---
title: Types of Data
description: Learn the key differences between quantitative vs qualitative and structured vs unstructured data, and understand how each type impacts data analysis and decision-making.
---
import { Aside } from "@astrojs/starlight/components";
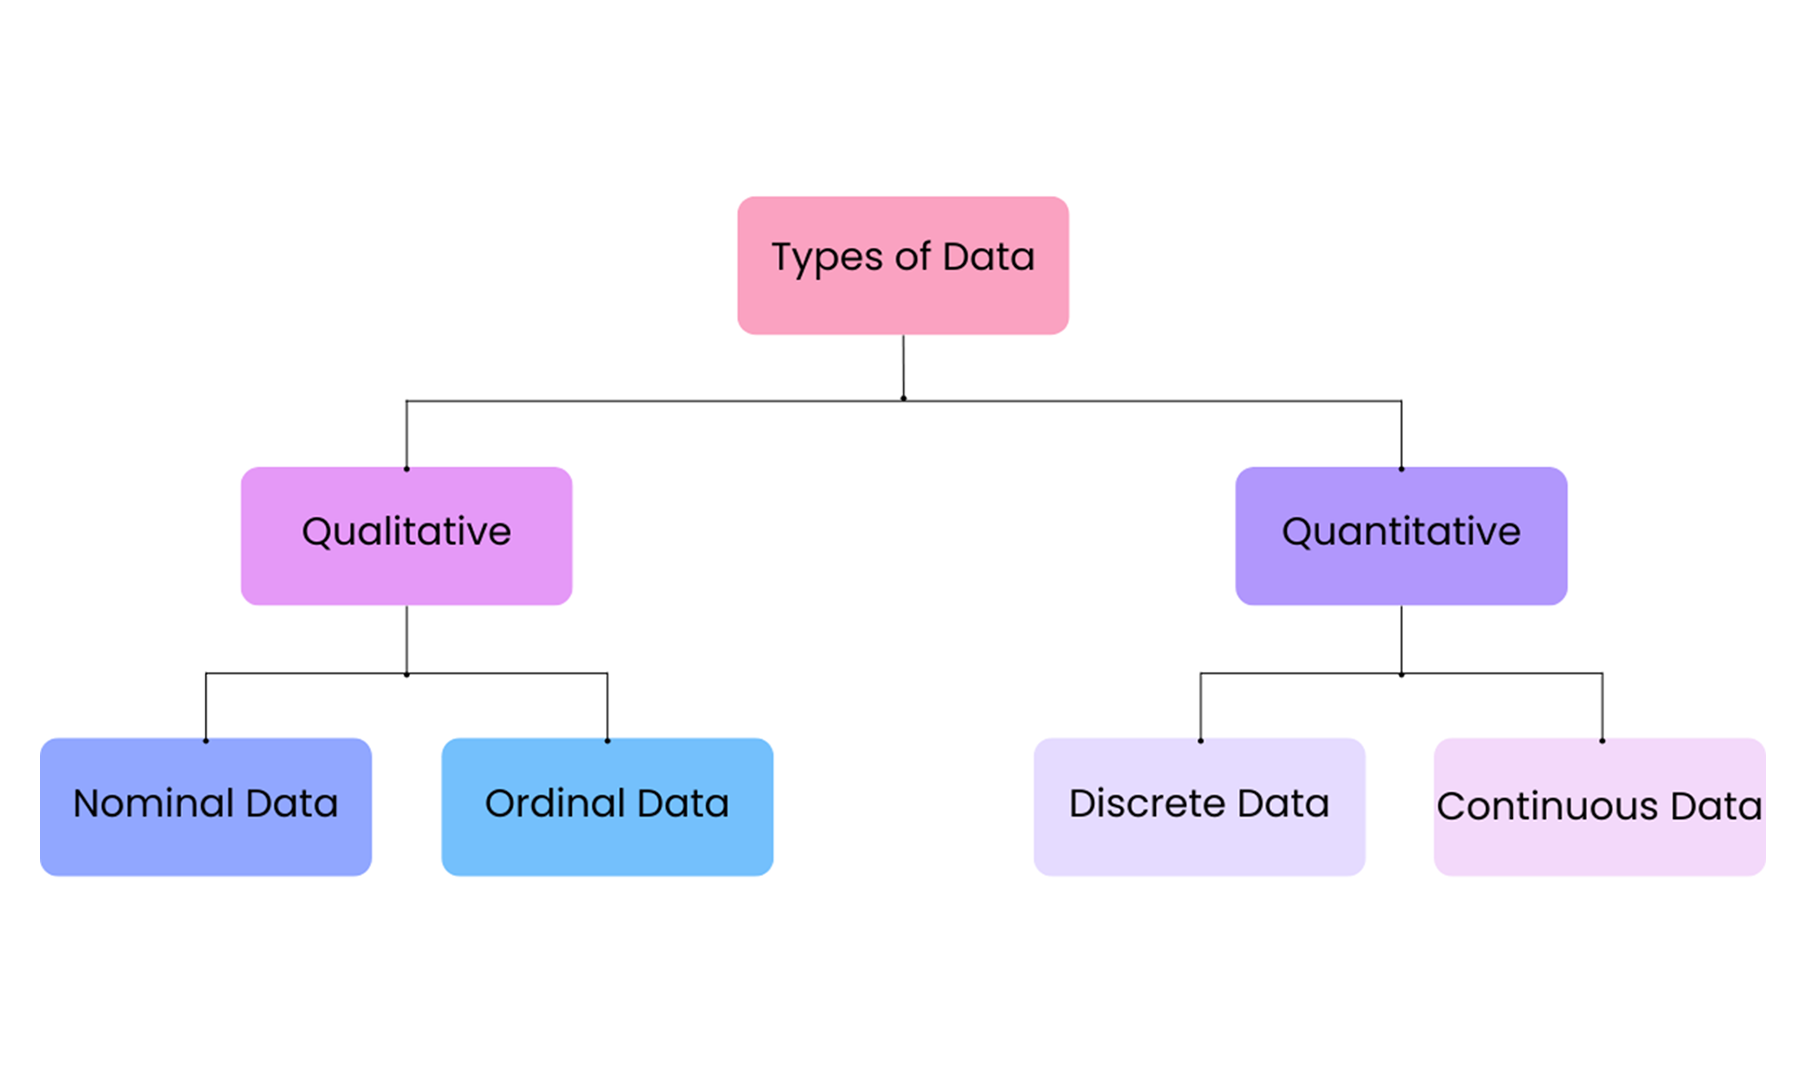
Data is broadly classified into two types - quantitative and qualitative data.
Quantitative data are numerical values that can be measured or counted. These can be used for precise calculations and statistical analysis. Quantitative data answers the question of how much, how many, and how often.
Qualitative data are categorical values that help describe or identify a variable type such as colour, name, religion, country, etc. Qualitative data answers the question of what, why, how, when, and where.
Qualitative and Quantitative data are classified into Nominal, Ordinal, Discrete, Continuous
Nominal data is a type of qualitative data that is used as a label or name without having any specific order. Their values are distributed into distinct categories. Nominal data is categorised into distinct groups and often analysed by counting the frequency of occurrence in each category. They are commonly visualized using bar, column, or pie charts.
Ordinal data is a type of qualitative data that represents categories with a proper order or hierarchy to them by their position on scale. Ordinal data cannot be analysed by counting the frequency of occurrence. The difference between values can’t be evaluated. Ordinal data are commonly visualized with gauge chart, or bar charts.
Discrete data is a type of quantitative data that consists of distinct values and can be counted. The value is represented as a whole number without fractional or decimal components. Discrete data is visualized with bar or other graphs to show individual countable values.
Continuous data is a type of quantitative data that can be measured. It can take any value within a given range and is not restricted to whole numbers. The data values can have fractional or decimal components. Continuous data is visualized with histograms, line graphs, or scatter plots.
It is important for businesses to record and analyse the various types of data using techniques that are apt. In the next section, we will understand how Data Analysis helps businesses to uncover patterns and derive meaningful insights from different types of data.