
Data Modelling in Infoveave
Data modelling in Infoveave involves creating fact and dimension tables, configuring measures and dimensions, creating hierarchies and defining relationships between fact and dimension tables. To effectively create a star schema, it is essential to understand the dataset and its structure. Each table serves a specific purpose in the data model. Here is a breakdown of the dataset and its relevance.
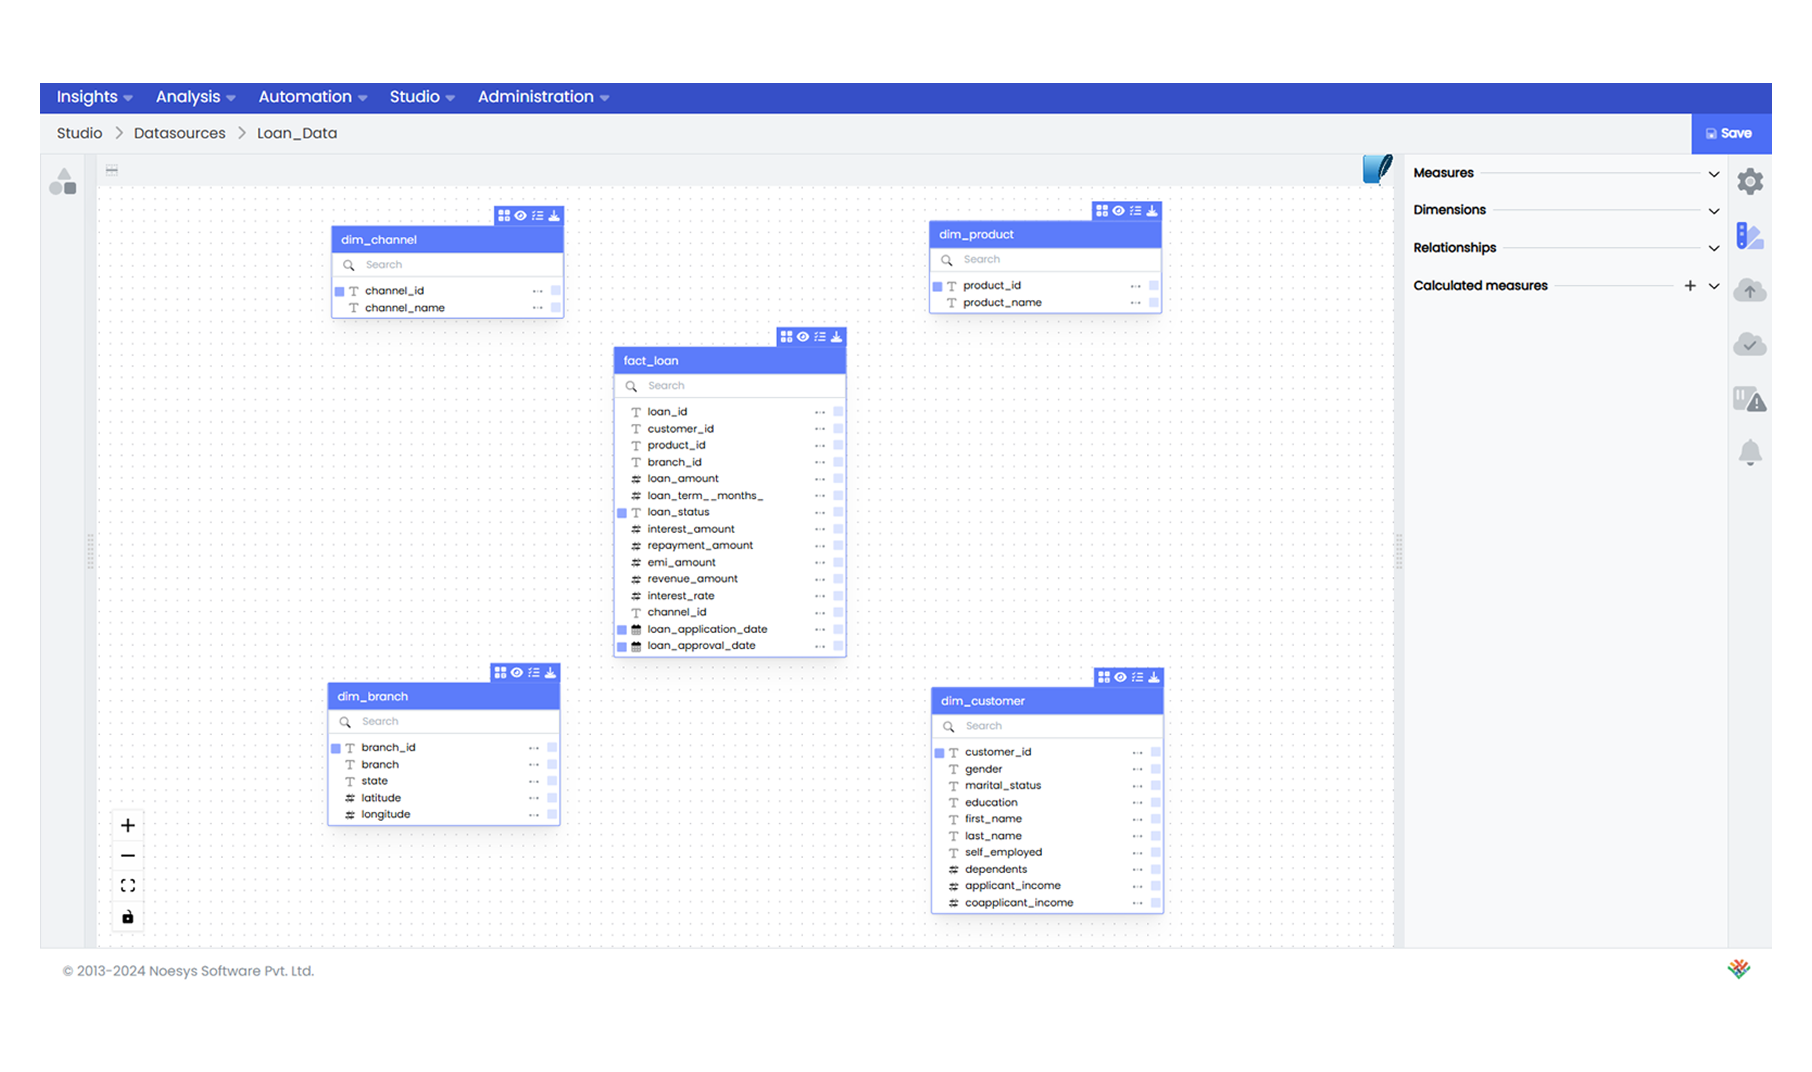
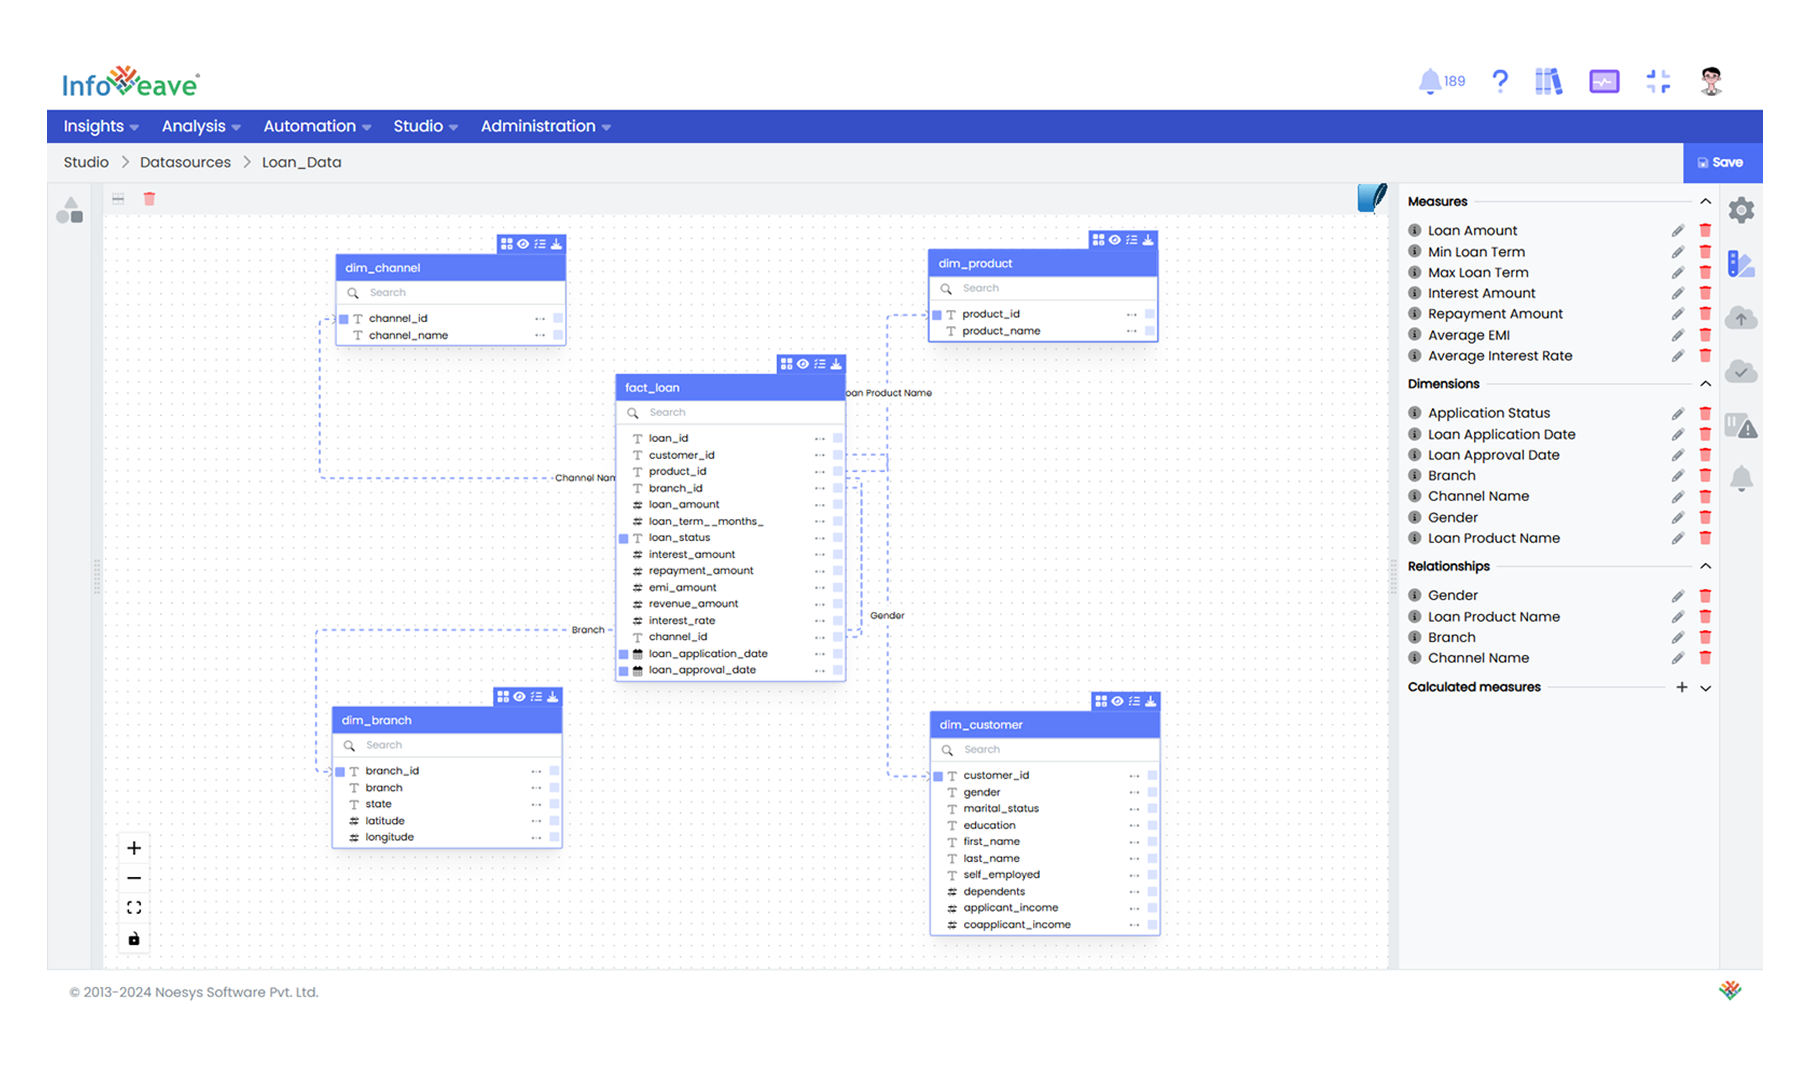
The fact table serves as the analytical core, aggregating transactional data. For instance, in here, the Fact Loan Table acts as the fact table, containing metrics like loan amounts, interest rates, and loan statuses.
Dimension tables provide the necessary context to analyze and categorize data in the fact table. Key dimension tables include:
- Dim Customer: Contains columns such as age, income range, and name.
- Dim Product: Details about loan products.
- Dim Branch: Geographical and operational data about branches.
- Dim Channel: Information on the medium through which the loan was availed, such as bank or agency.
The schema links the fact table to dimension tables through key columns.
- Customer ID connects the Dim Customer to the Fact Loan Table.
- Branch ID links the Dim Branch to the Fact Loan Table.
- Channel ID links the Dim Channel to the Fact Loan Table.
- Product ID links the Dim Product to the Fact Loan Table.
Let us now learn to create the star schema in Infoveave. Follow the below steps to effectively build the data model connecting to Microsoft SQL Server.
Step 1: Connecting to Microsoft SQL to Infoveave
Before designing the schema, establish a connection between Microsoft SQL and Infoveave:
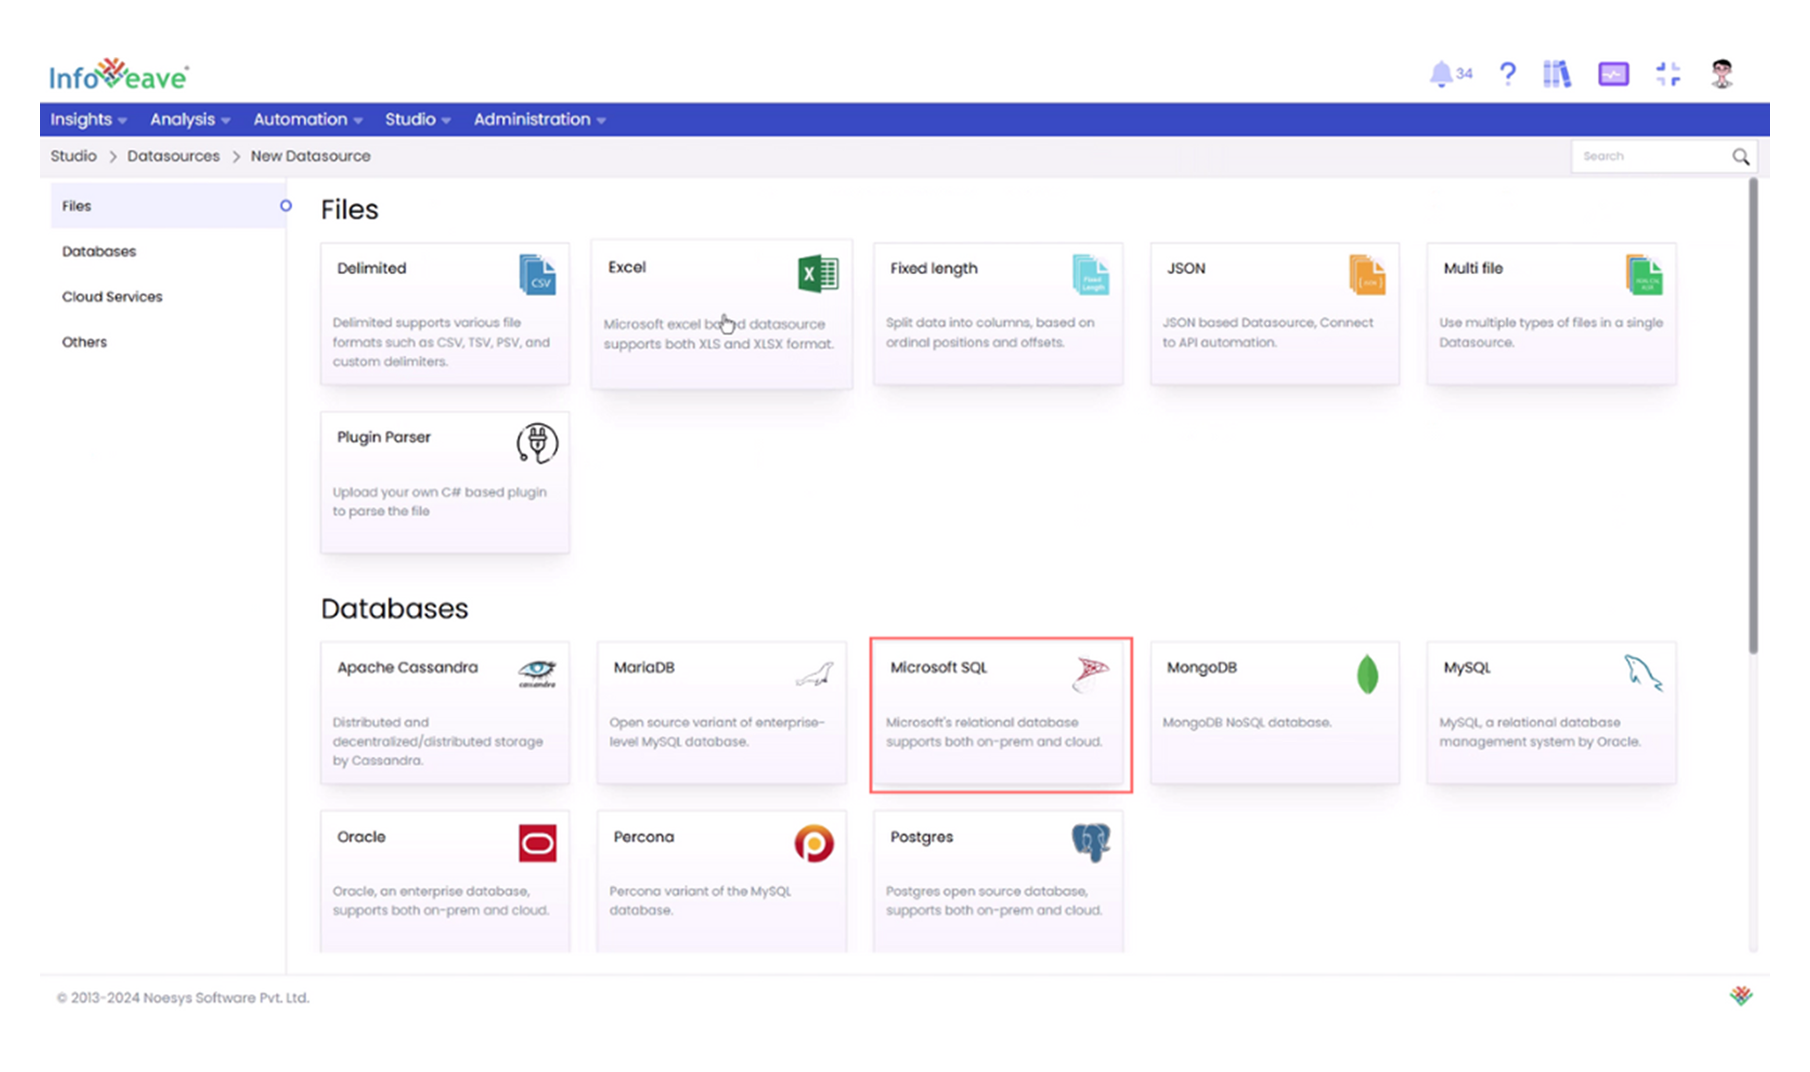
- Set Up a Microsoft SQL Datasource: In Infoveave, go to the Studio menu, navigate to Datasources, select New Datasource, and choose Microsoft SQL as the datasource type.
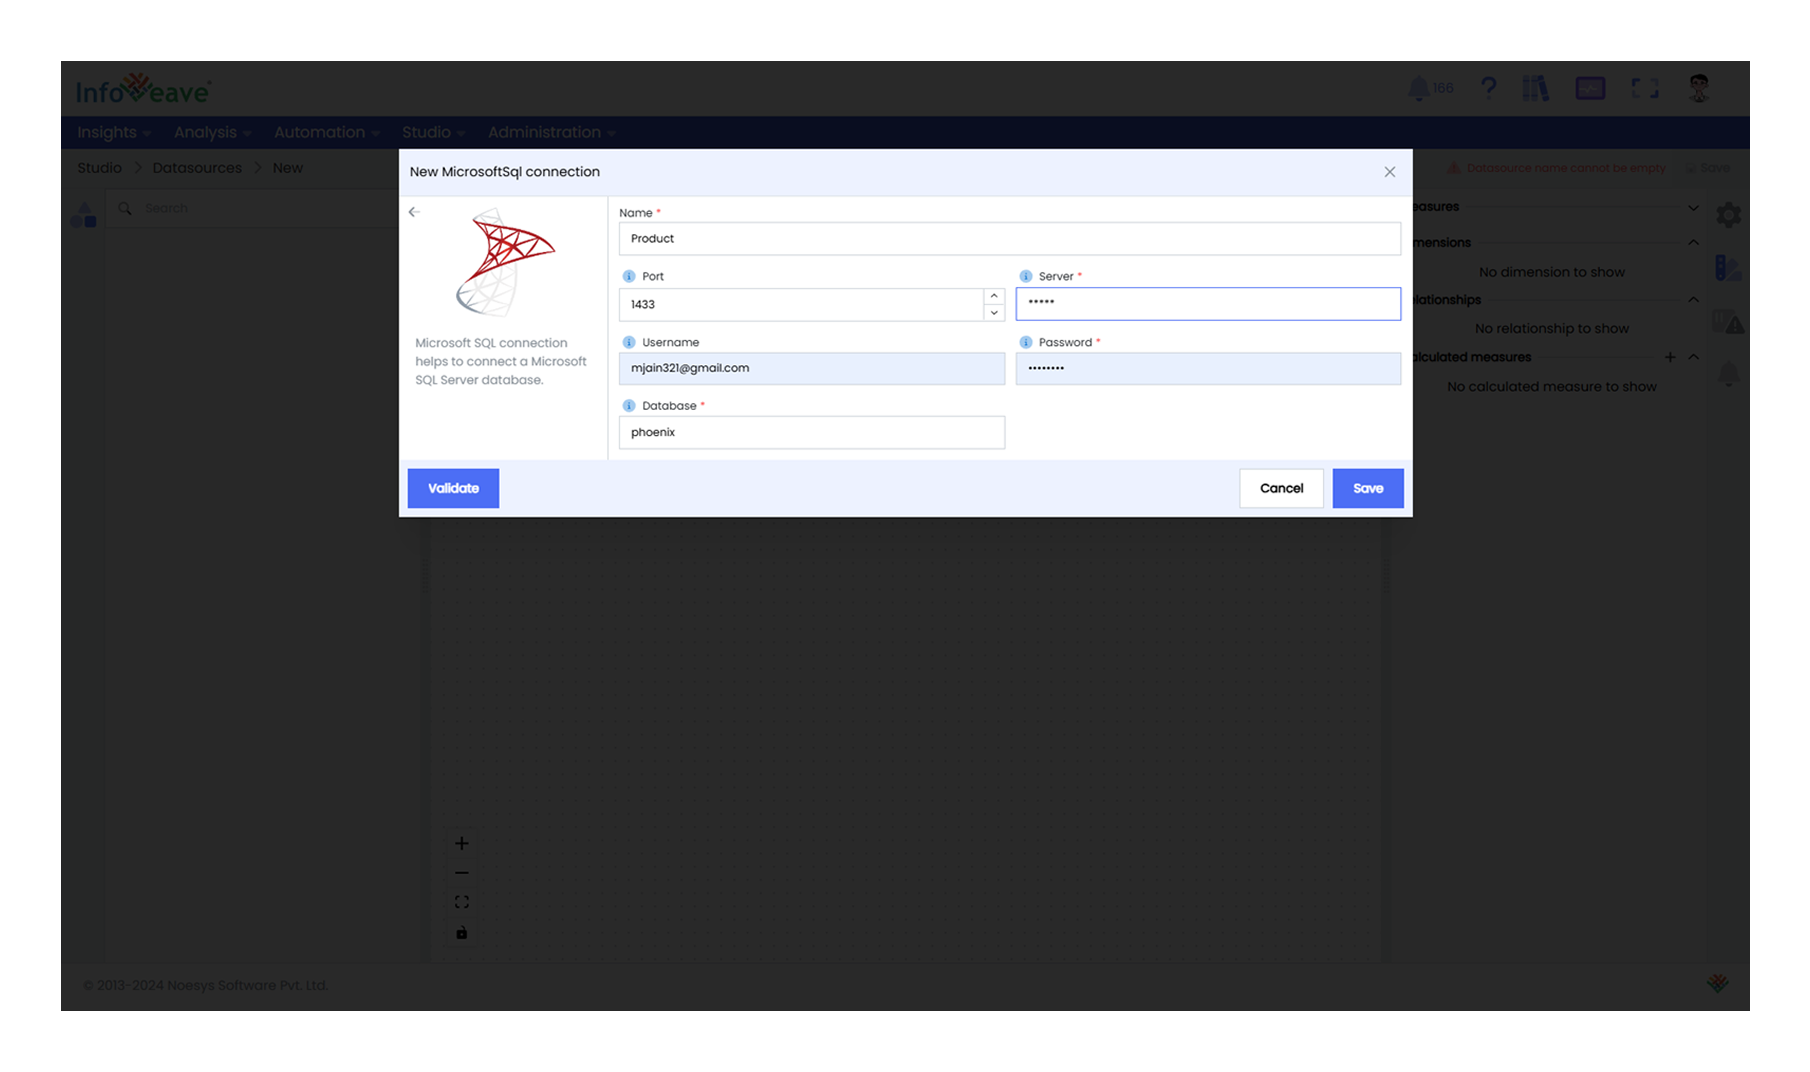
- Create and Validate the Connection: Provide the server details, database name, port, username, and password, then validate and save the connection.
- Import Tables: Drag and drop the necessary tables (fact and dimensions) into the datasource designer area.
Step 2: Defining Measures and Dimensions in Infoveave
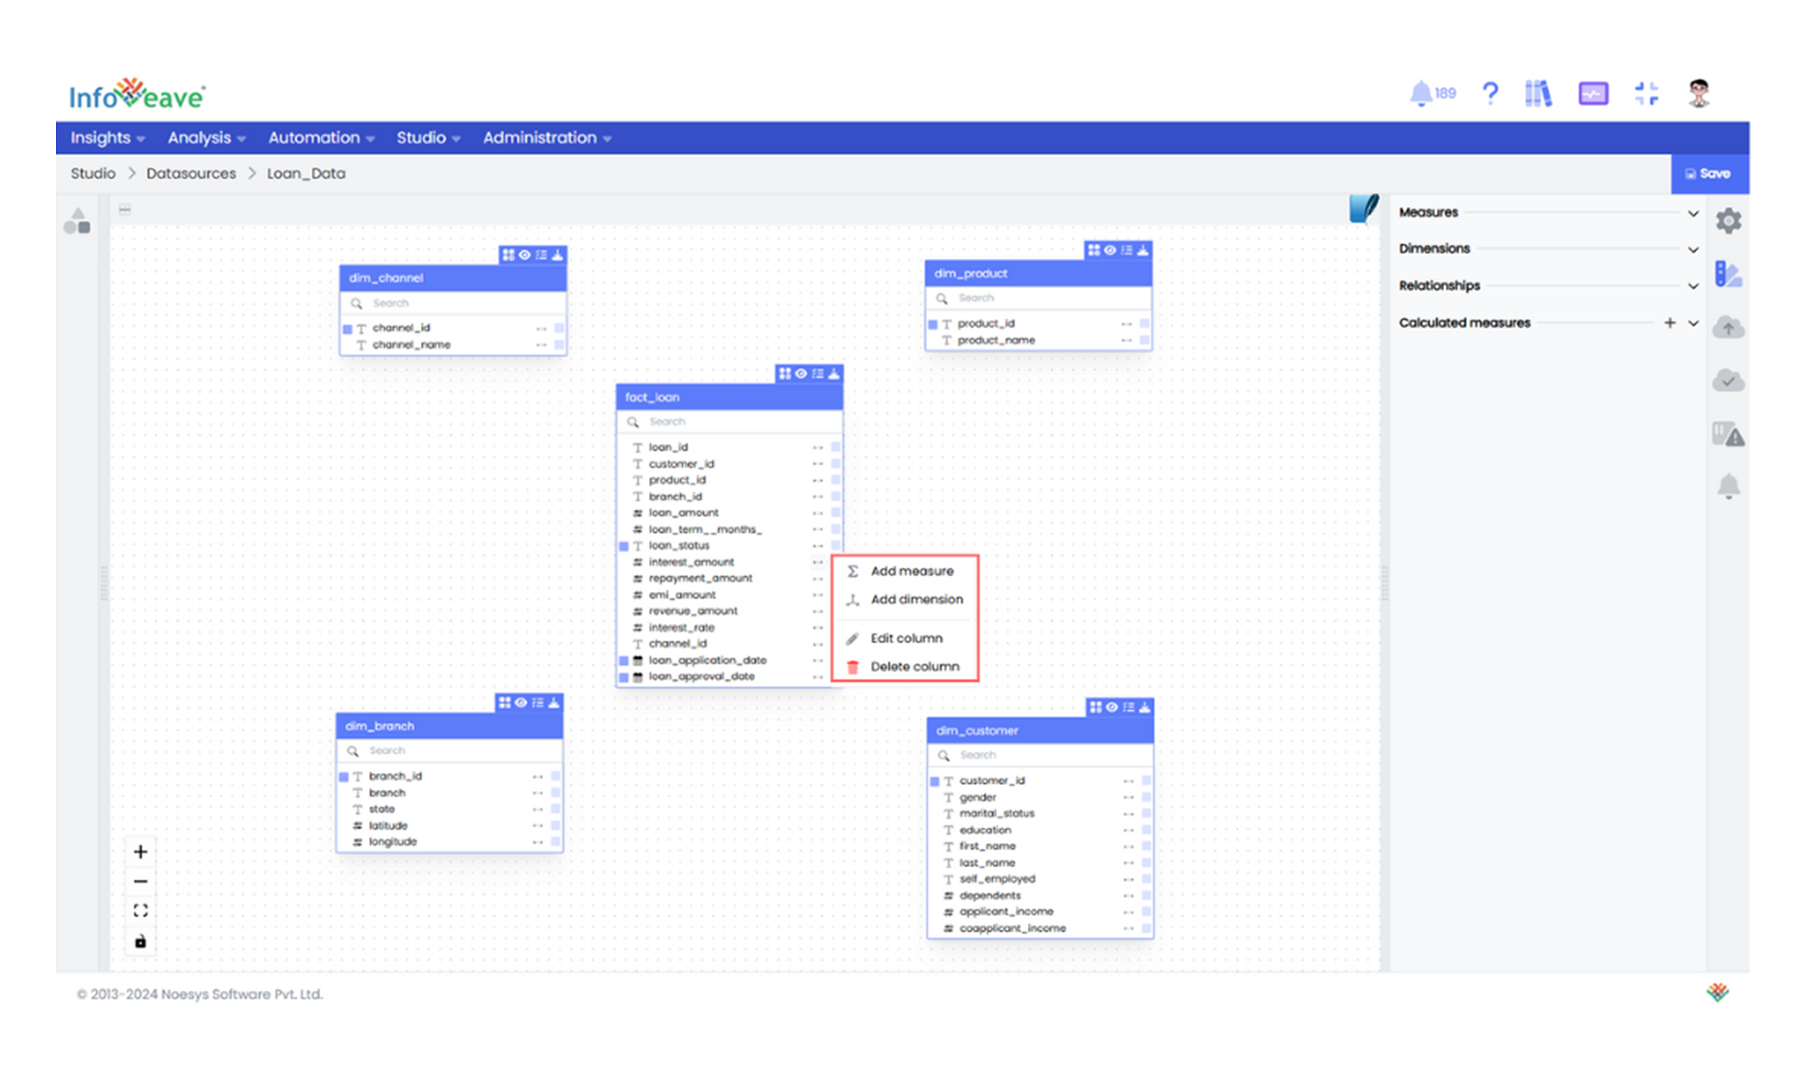
After importing the fact and dimension tables from Microsoft SQL into Infoveave, the next critical step is defining measures and dimensions. Measures are numerical values that quantify data, such as loan amounts and interest rates. Infoveave allows you to aggregate and calculate these measures using functions like SUM, AVERAGE, COUNT, DISTINCT COUNT, MAX, and MIN. Dimensions are categorical data attributes, such as branch location and customer type that provide context and help filter, group, and analyze data.
- Configure Measures: Identify numerical columns in your tables, such as Loan Amount and click the Add Measure icon next to the column.
- Select an Aggregation Type: Start with the Loan Amount column and use SUM to calculate the total loan disbursed. This gives a clear view of the overall loan volume. Rename the measure, set the format, adjust the precision, and add a description to explain its purpose.
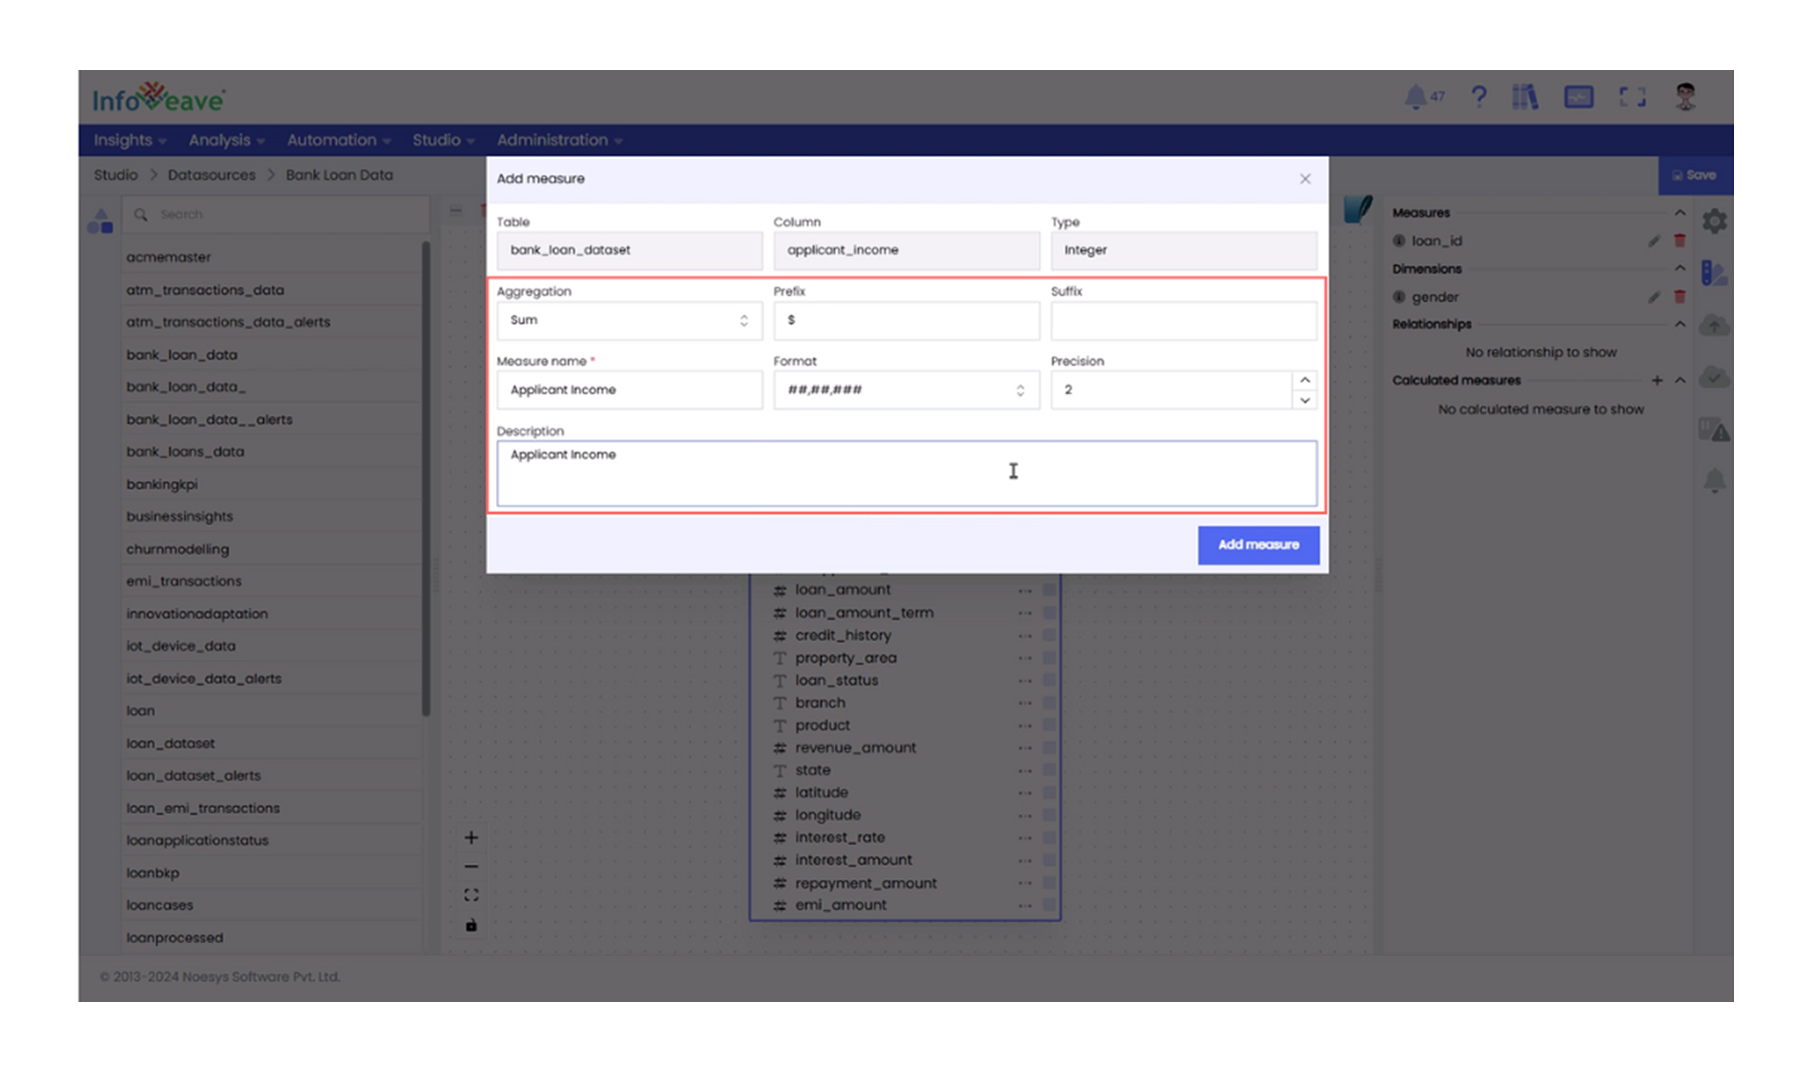
After applying SUM as the aggregation type to the Loan Amount column, you can explore other columns in your tables using different aggregation types to gain more insights.
- Configure Dimensions: After configuring measures, identify descriptive columns in your tables, such as Branch, and define as dimensions.
Step 3: Designing the Star Schema in Infoveave
Once dimensions are defined, the next step is to establish relationships by selecting the key column in each dimension table that corresponds to the key column in the fact table. For example, in the Dim Branch table, the Branch ID serves as the key column that connects it to the Fact Loan table, ensuring accurate mapping and seamless integration of data across tables.
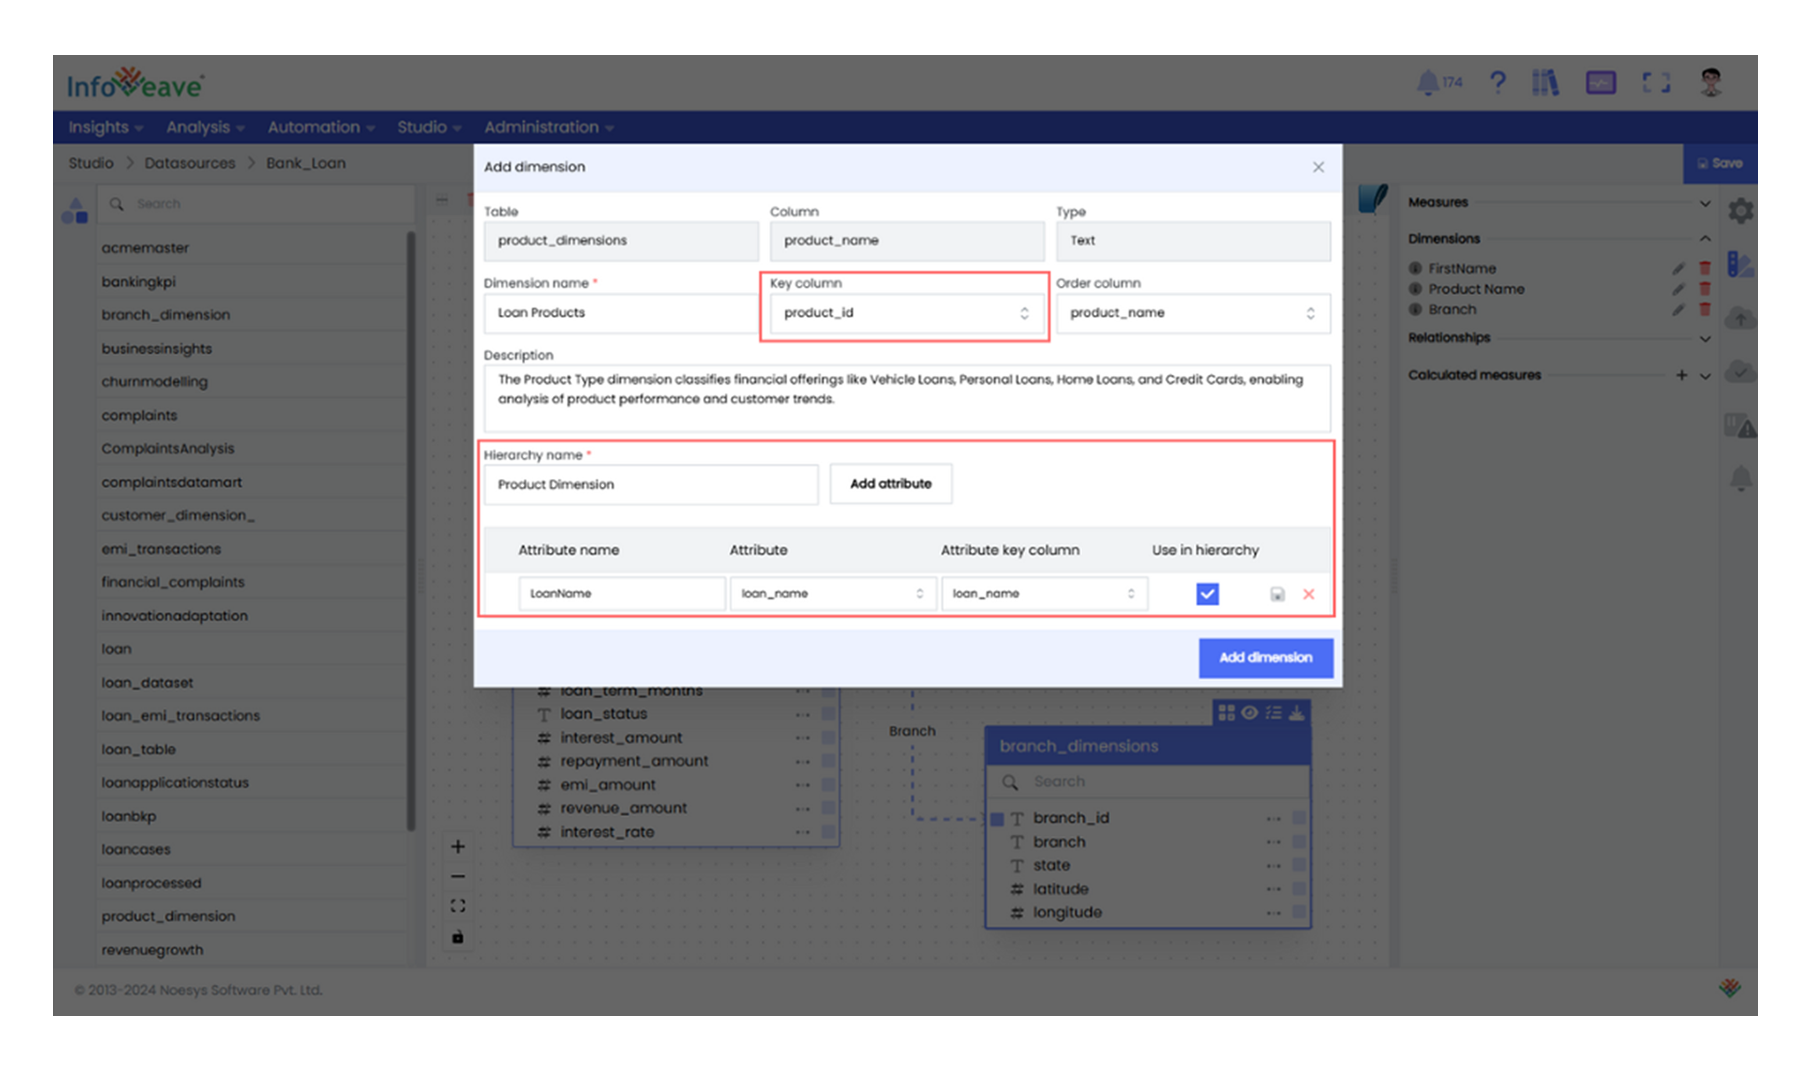
- Choose the Key Column: Begin by selecting the key column in each dimension table that corresponds to the fact table’s key column. This helps establish the relationship between the dimensions and fact tables. For example, when defining Branch as the dimension, define Branch ID as the key column.
- Define Hierarchies and Add Attributes: After selecting the key column, define hierarchies and add attribute columns. They provide a structured, multi-level view of data, allowing users to drill down into specific details or roll up for broader insights.
- Link Dimension Tables to the Fact Table To complete the star schema, connect each dimension table to the fact table using their respective key columns. These relationships form the backbone of the schema, allowing data to flow between the fact table and dimensions for analysis and visualization.
Now that we have understood how to design a data model, the next step is to learn how to transform and load data from multiple sources into the Star schema of the data warehouse. In the next section, we will see how workflow automation in Infoveave streamlines the data extraction, transformation and loading process into the DWH.