Create Excel Template Report in Infoveave
Creating an Excel report using the Infoveave plugin is a structured process that integrates the plugin with Excel, allowing users to generate data-rich, customizable reports Excel reports in Infoveave are useful for visualizing data and generating detailed insights directly within the Excel sheets. By leveraging Infoveave’s powerful features, you can automate reporting, refresh data dynamically, and schedule reports for regular updates.
Below, let us break down the process into detailed step-by-step instructions for setting up the plugin, inserting data, and managing report templates.
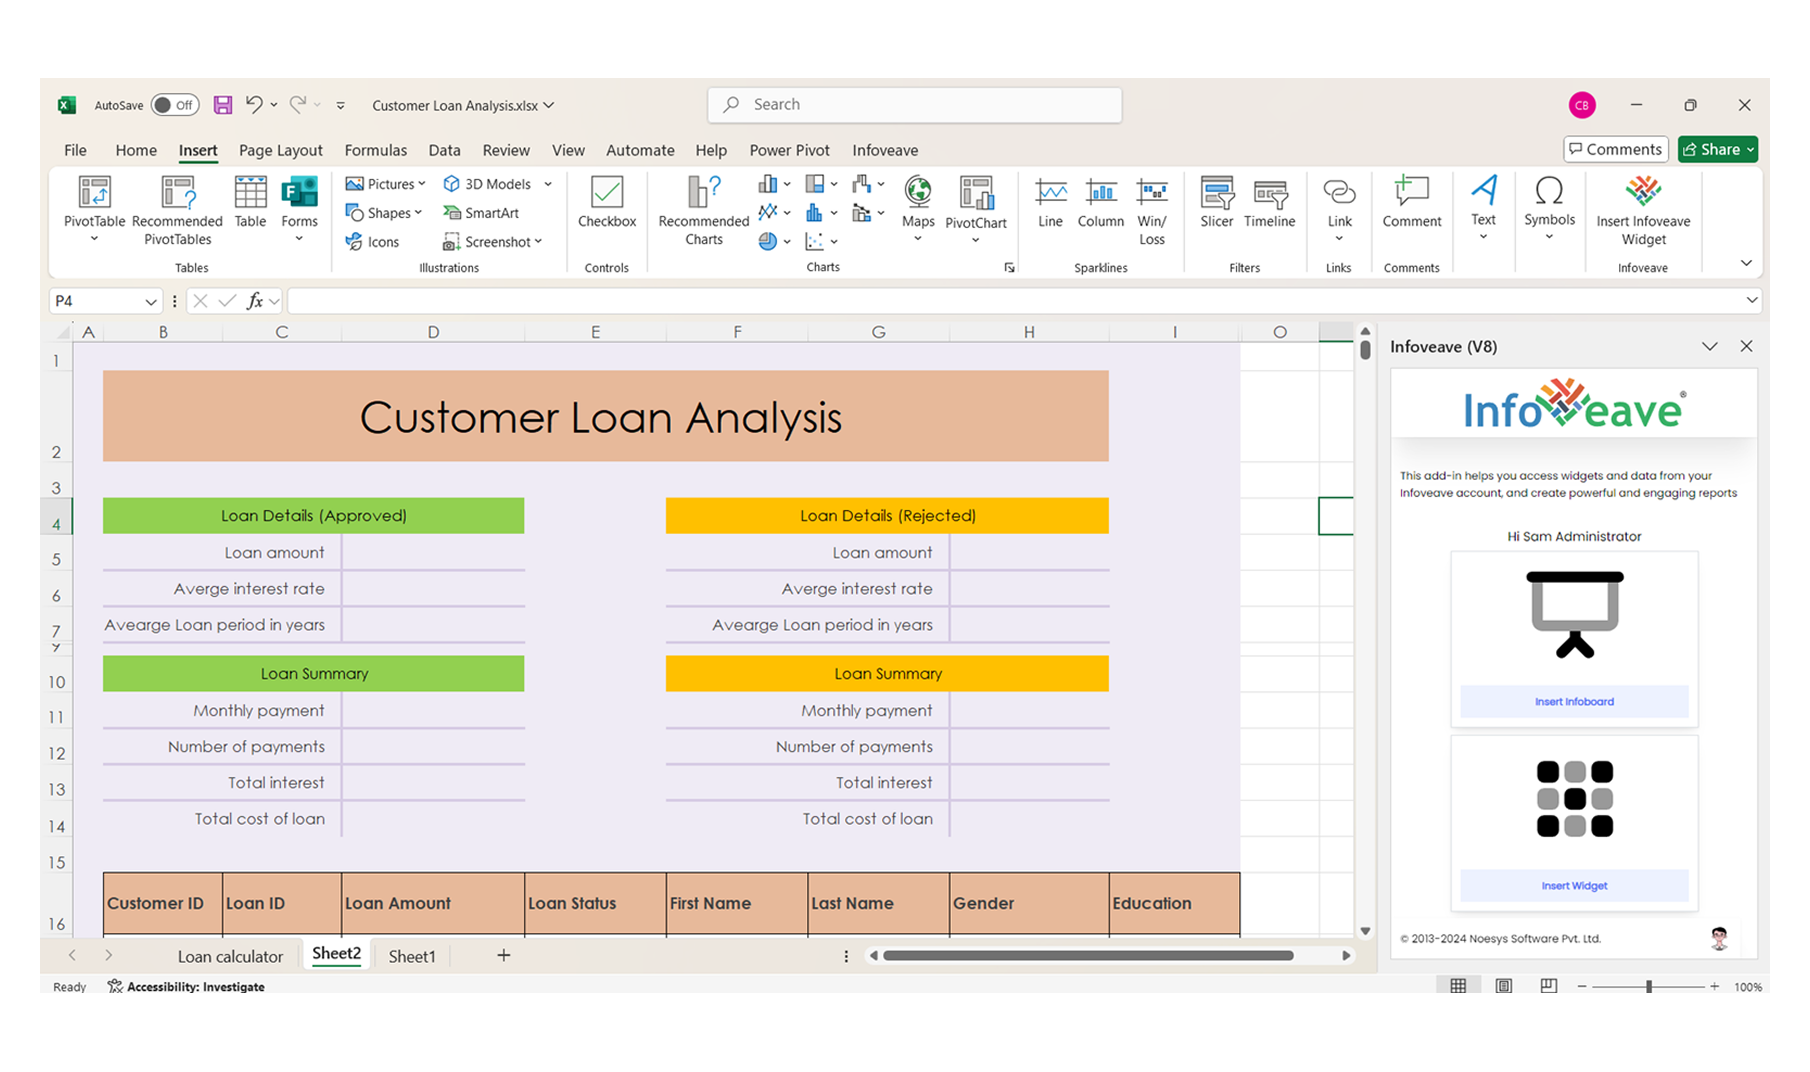
Step 1: Install and Set Up the Infoveave Plugin
-
Install Infoveave Plugin: Install the Infoveave plugin in Excel by opening Excel, going to the Home tab, and adding the plugin. Once installed, log in using your Infoveave URL and credentials.
-
Select Template: Select the appropriate report template to structure your data that suits your requirements
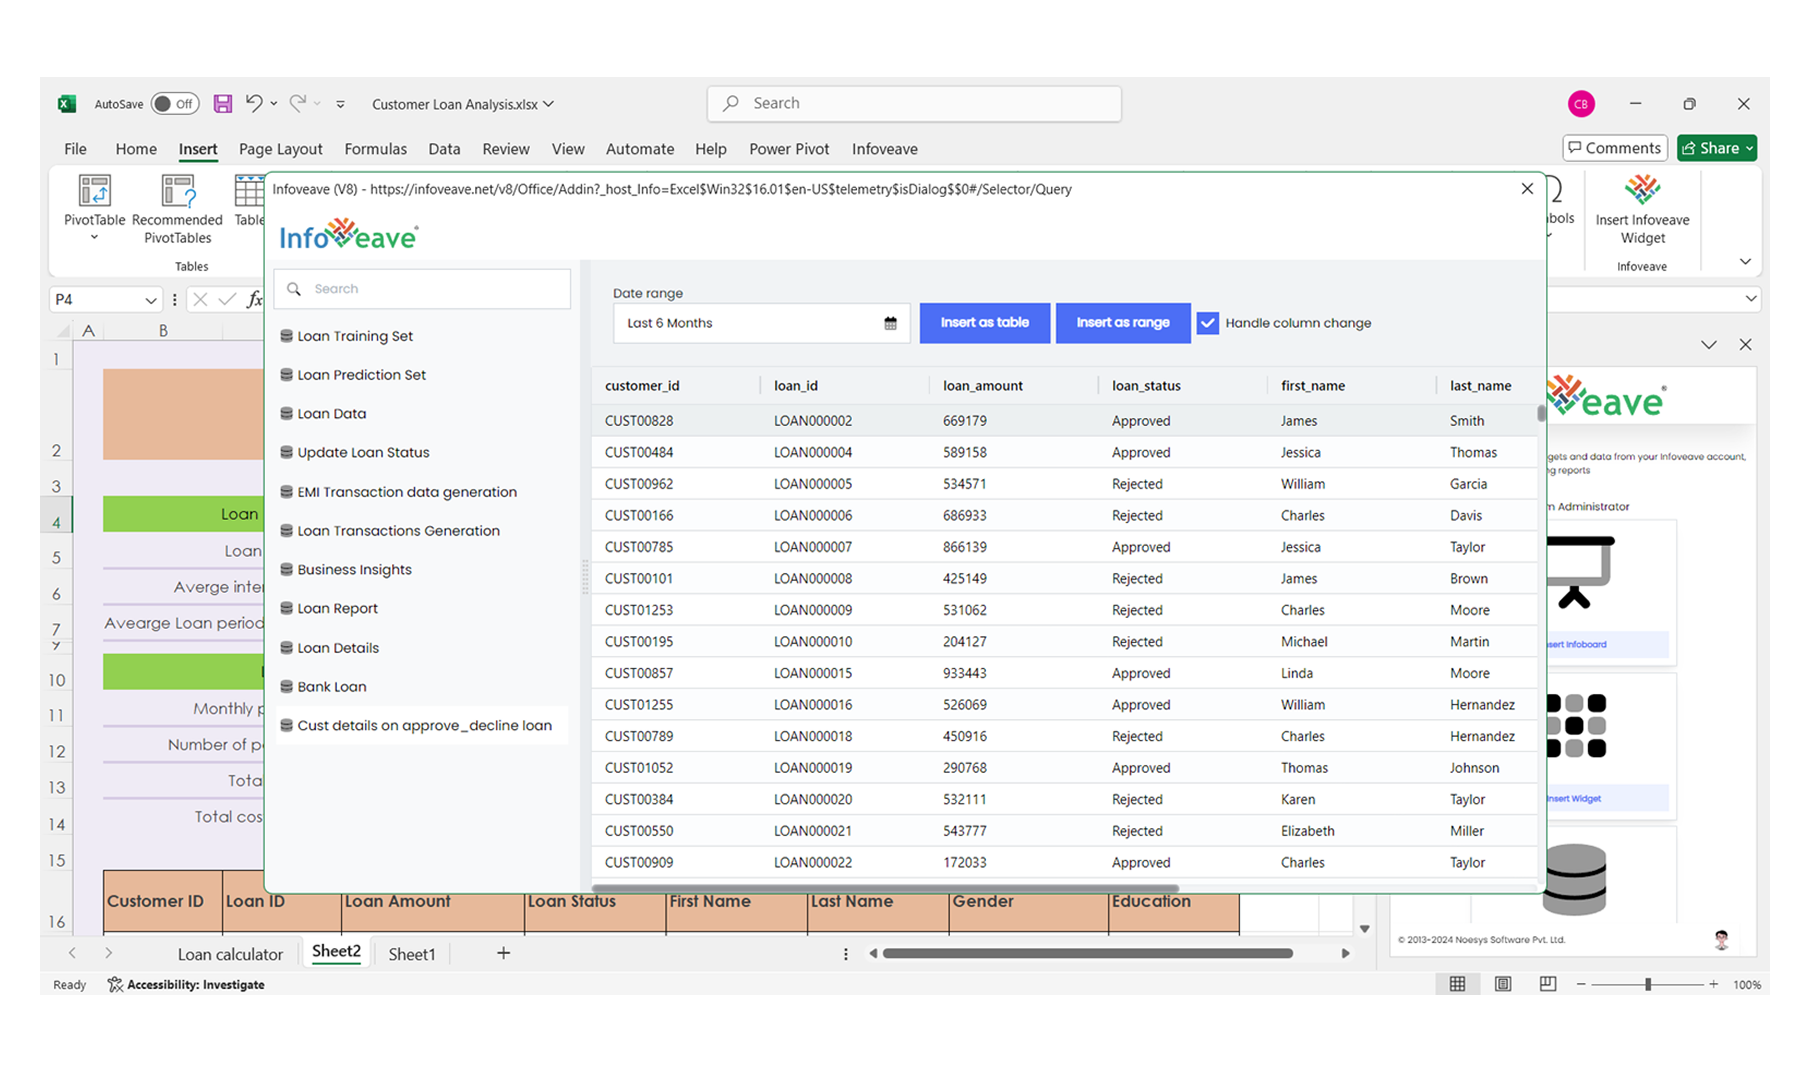
Step 2: Insert Data into the Template
- Select Query and Define Date Range: Click Insert Data in the Infoveave plugin menu, select the required query with customer details, loan status, and dates, and define date range like “Last 7 Days” or “Last Month.” Then, insert the data as a table or directly into your report layout.
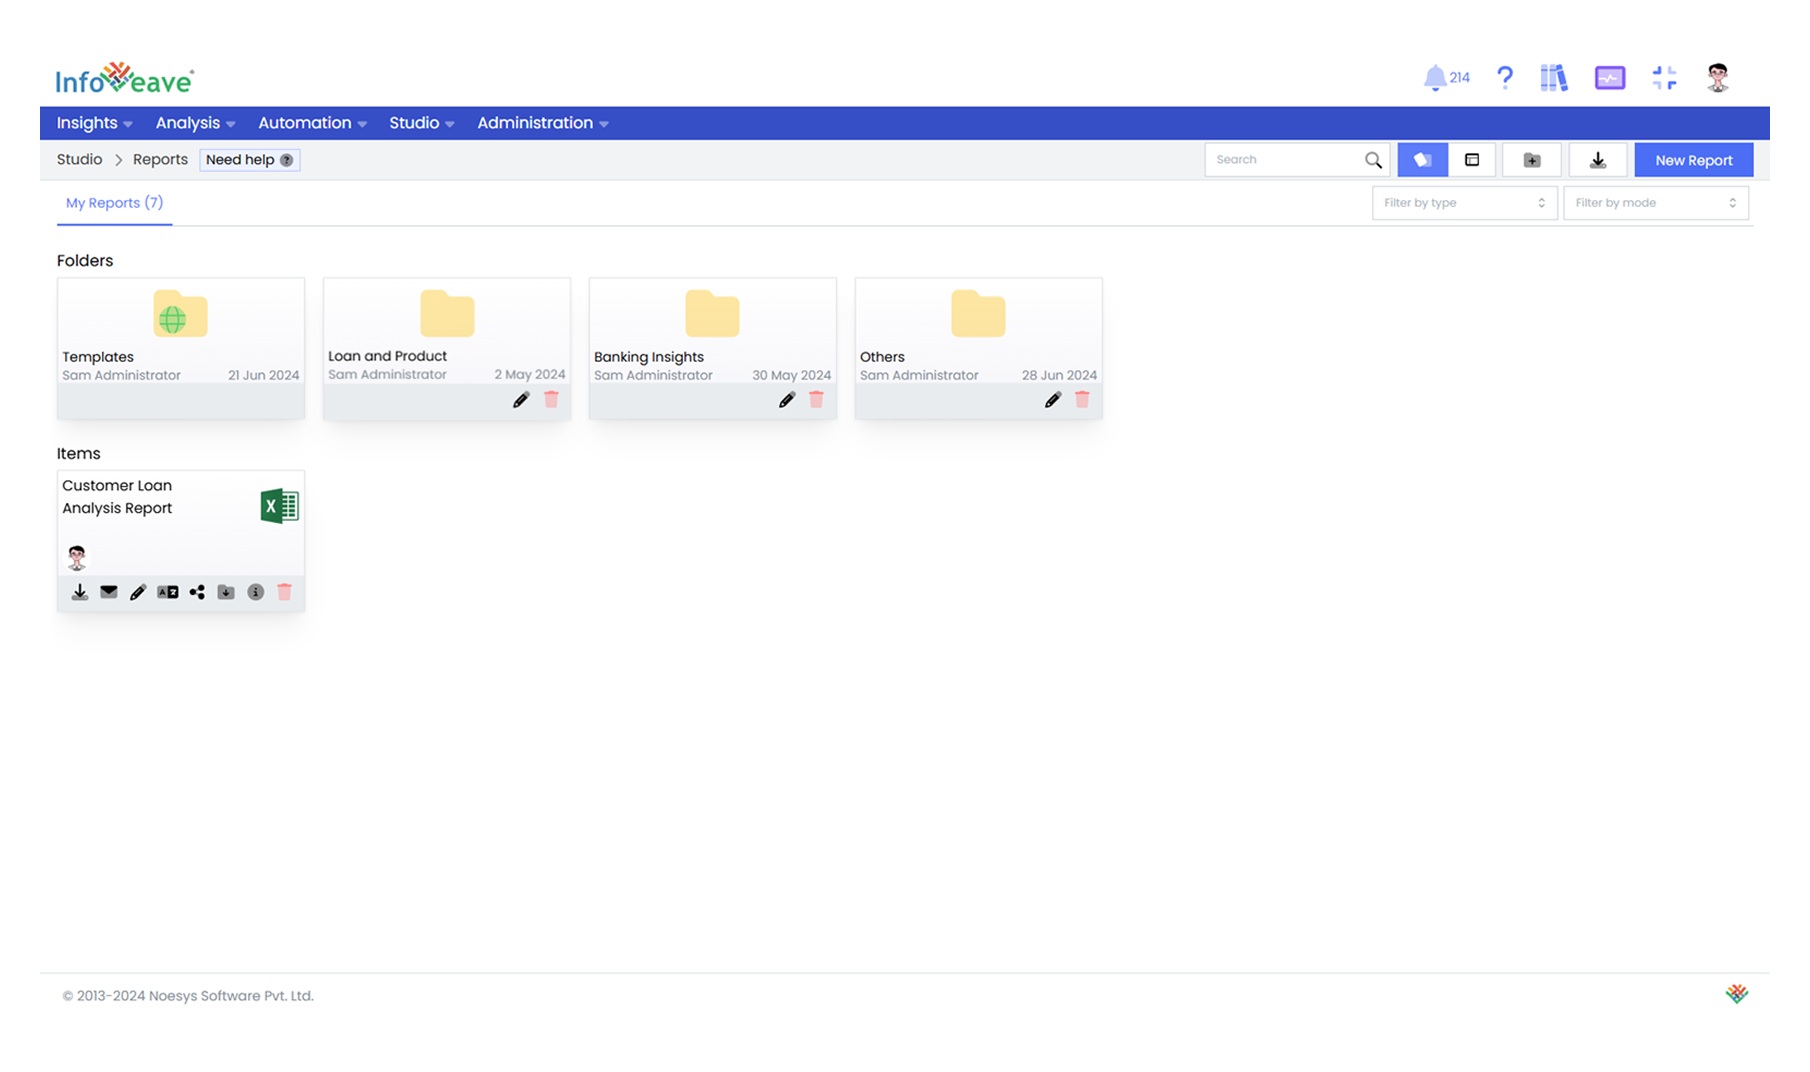
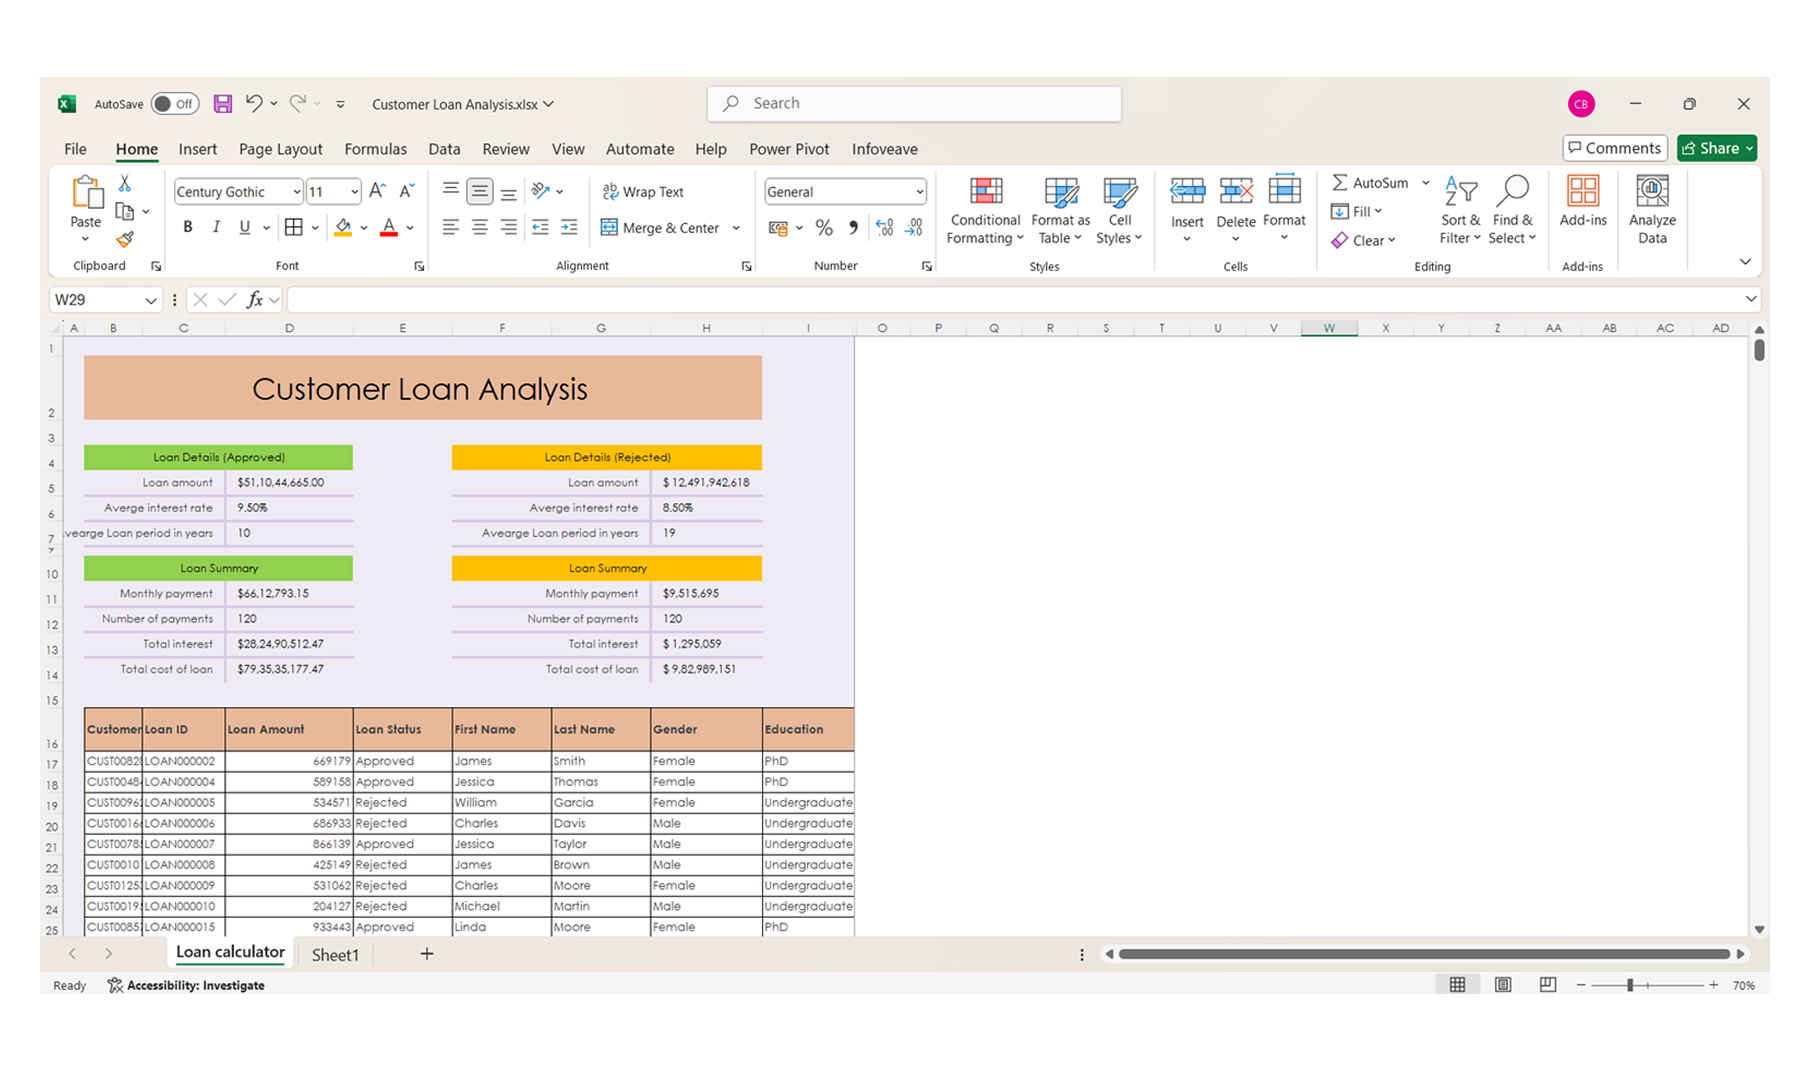
Step 3: Add Data and Upload Template in Infoveave
- Add Data: Insert the data as a table or add it directly into your Excel template.
- Upload the Template in Infoveave: Log in to your Infoveave account, go to the Studio section, and click Reports to upload the prepared Excel template to Infoveave.