Data Visualization Principles
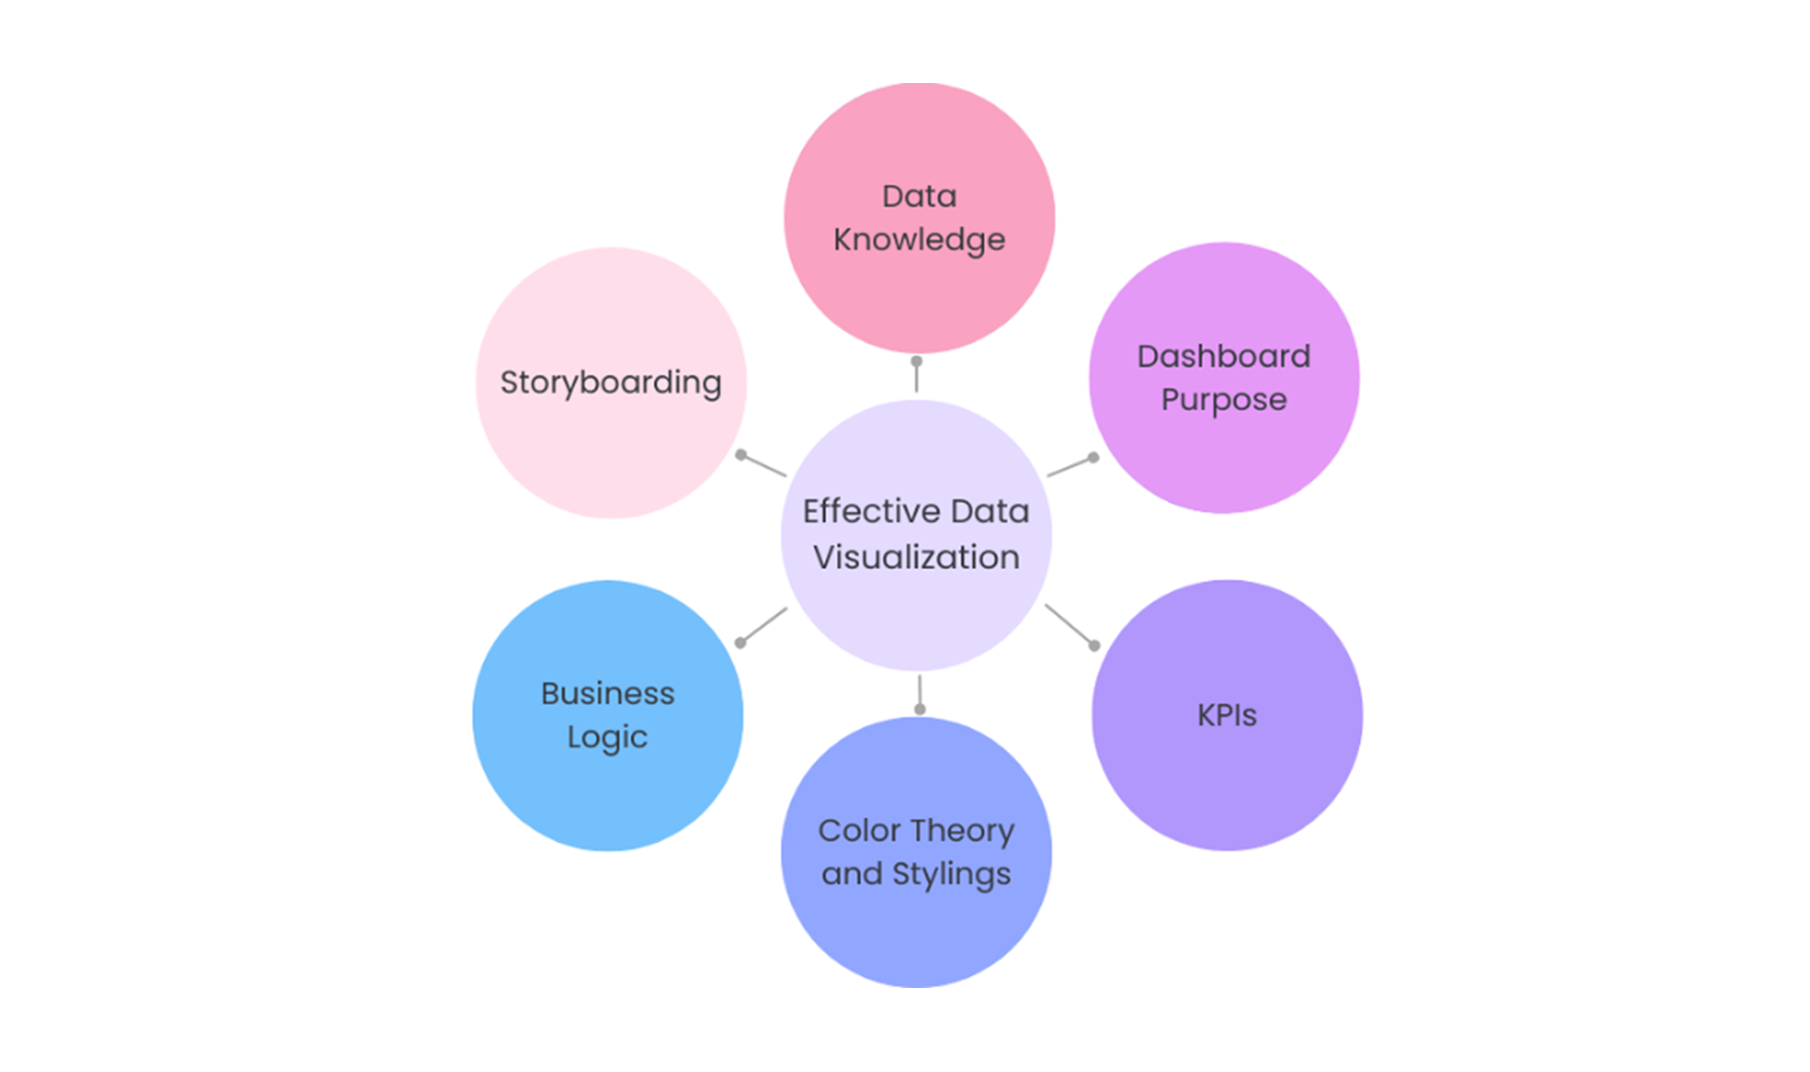
Data visualization turns complex information into clear visuals that are easy to understand. However, creating effective visuals takes more than just putting data on a chart. It requires understanding the data itself and applying good design practices to make the visuals clear and meaningful. Key principles knowing your data well, using the right colors, choosing readable text, and picking the best charts for your information. It is also important to keep designs simple, accurate, and free of clutter.