Widgets and Layers
Widgets and layers are key features in Infoveave’s Infoboard Designer. They make dashboards visually appealing, well-organized, and easy to understand. Widgets display data in various forms, while layers structure and arrange these elements to maintain clarity and highlight key information.
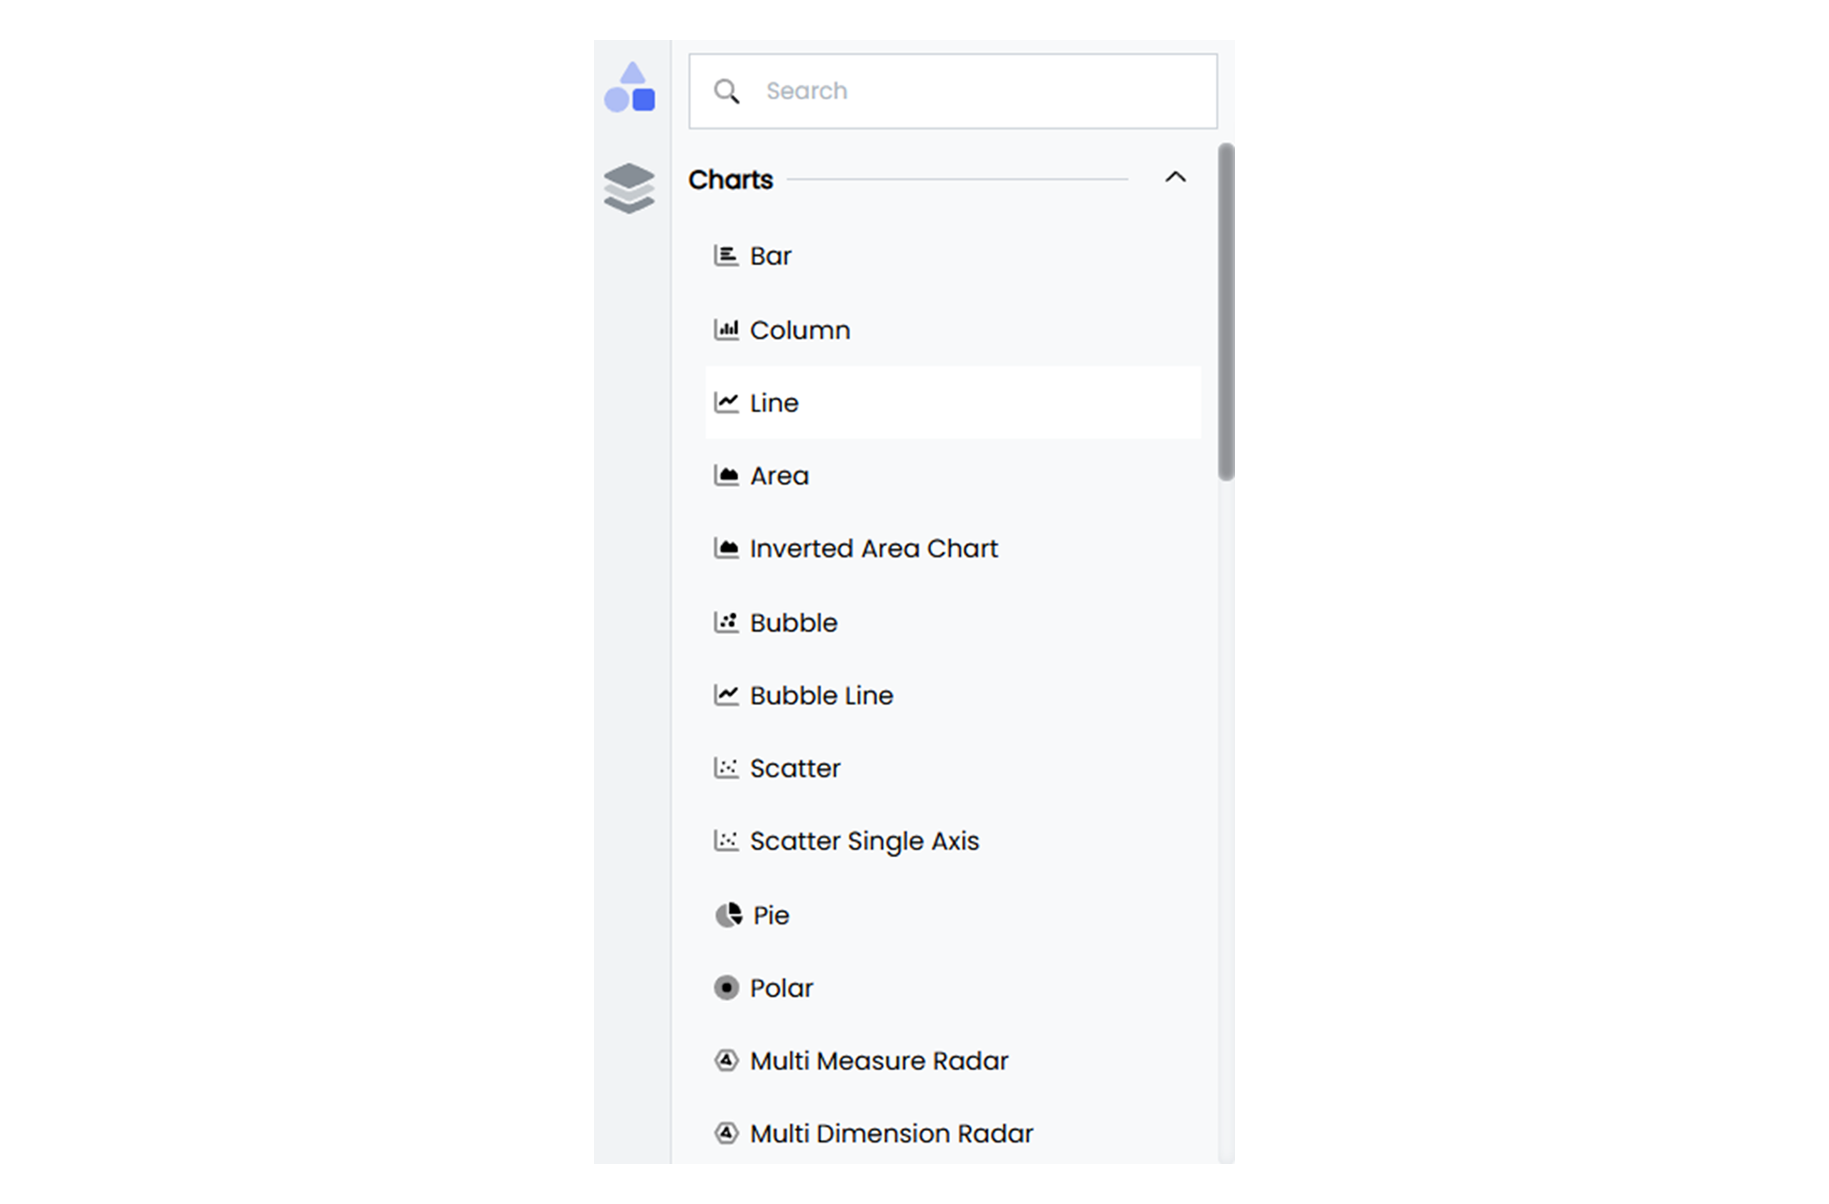
Widgets
Widgets are the main components used to display data on dashboards. They come in various types to suit different needs:
-
Charts: Bar charts, line graphs, pie charts, and scatter plots make it easy to compare values, show trends, or highlight proportions.
-
Tables: Tables present detailed data in rows and columns, making large datasets easy to explore.
-
Maps: Maps display location-based data and trends using markers or color gradients.
-
Images and Text Widgets: Add logos, icons, or explanatory text to enhance context and make dashboards more engaging.
-
Interactive Elements: Add dropdowns and checkboxes to filter data for deeper insights.
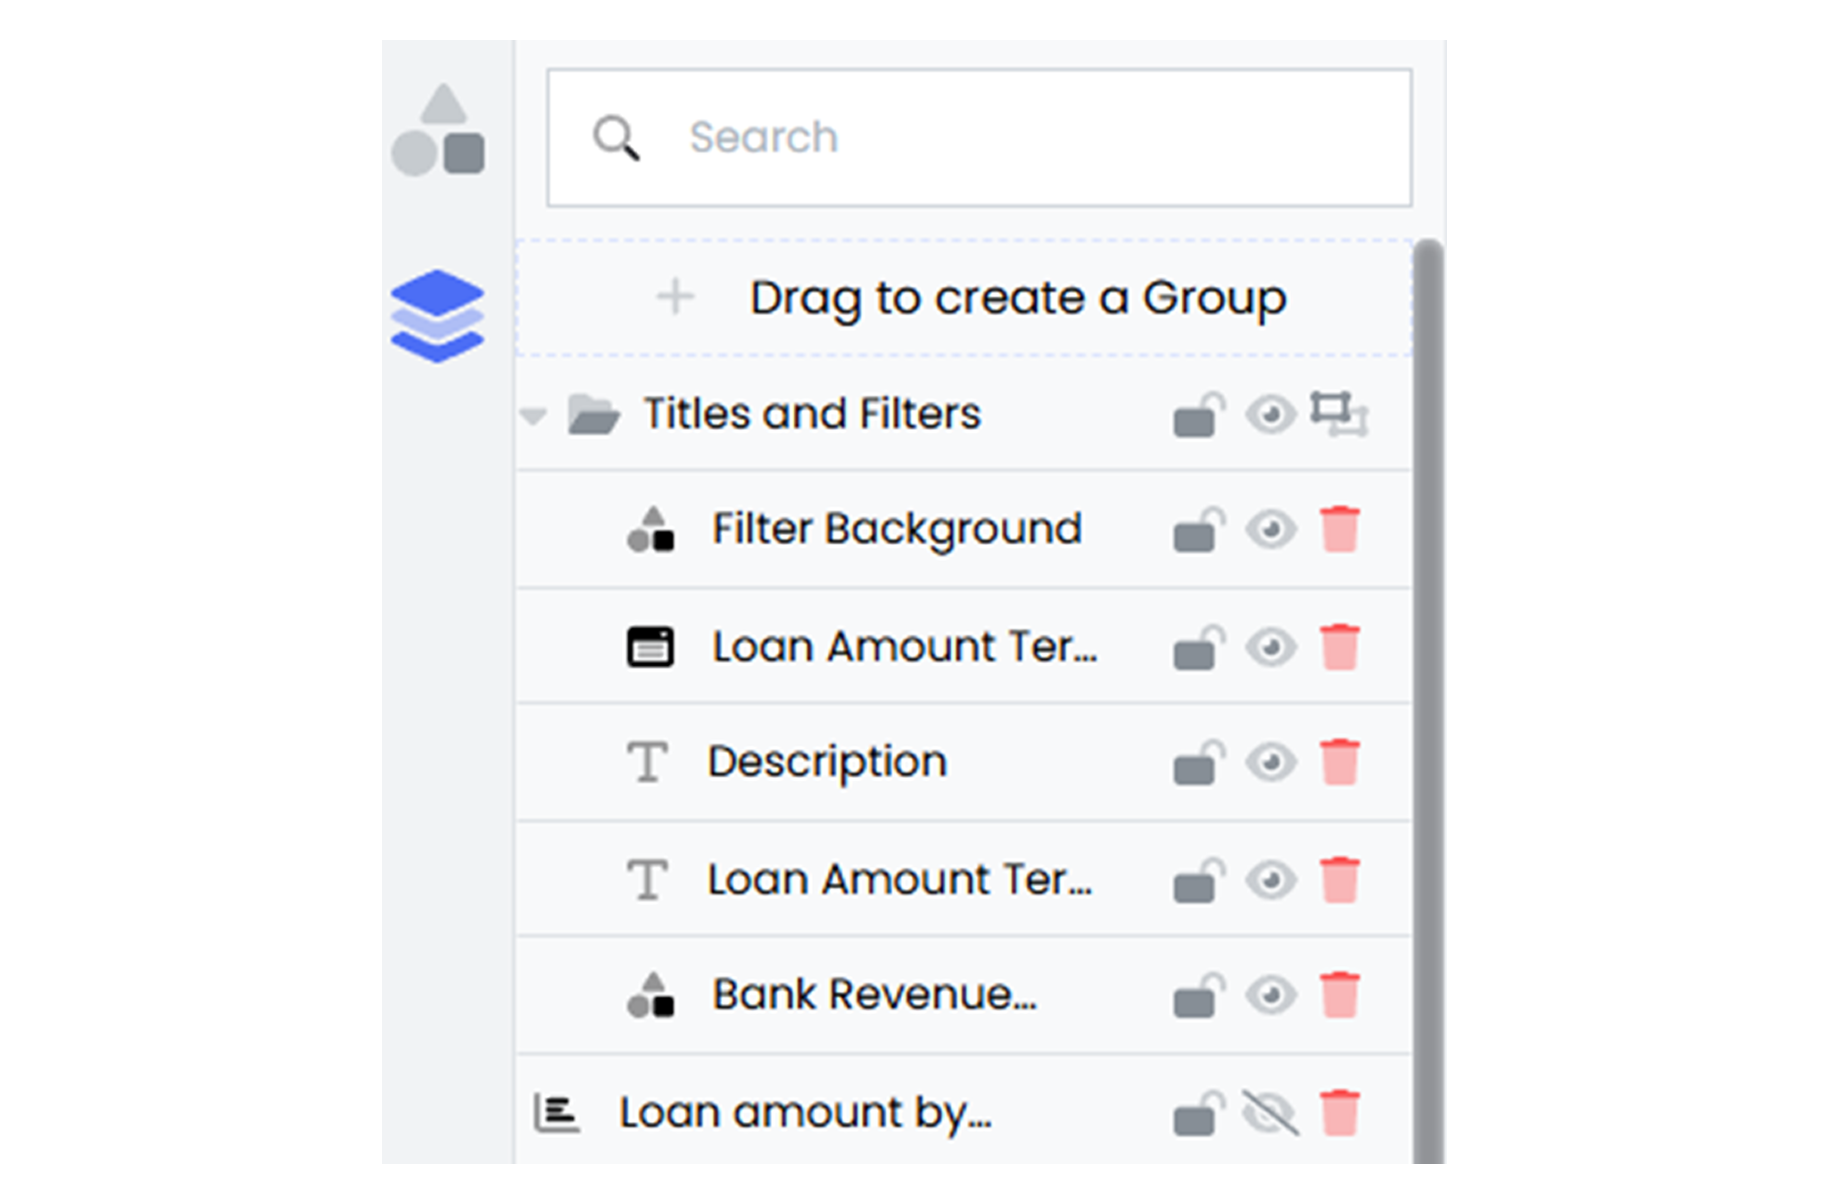
Layers and Groups
Layers and groups allow widgets to be arranged in a clear and visually balanced way. They make it possible to overlap elements, emphasize important information, and maintain a clean design.
-
Depth and Hierarchy: Layers bring key widgets to the forefront while keeping background elements subtle. Combine widgets, like placing a chart over a background image, to create attractive designs. Adjust Z-index values to bring critical widgets to the forefront or move supporting elements to the back.
-
Highlighting Data: Shapes like arrows or boxes placed on layers can emphasize critical trends or metrics, making dashboards more focused.