
Treemap
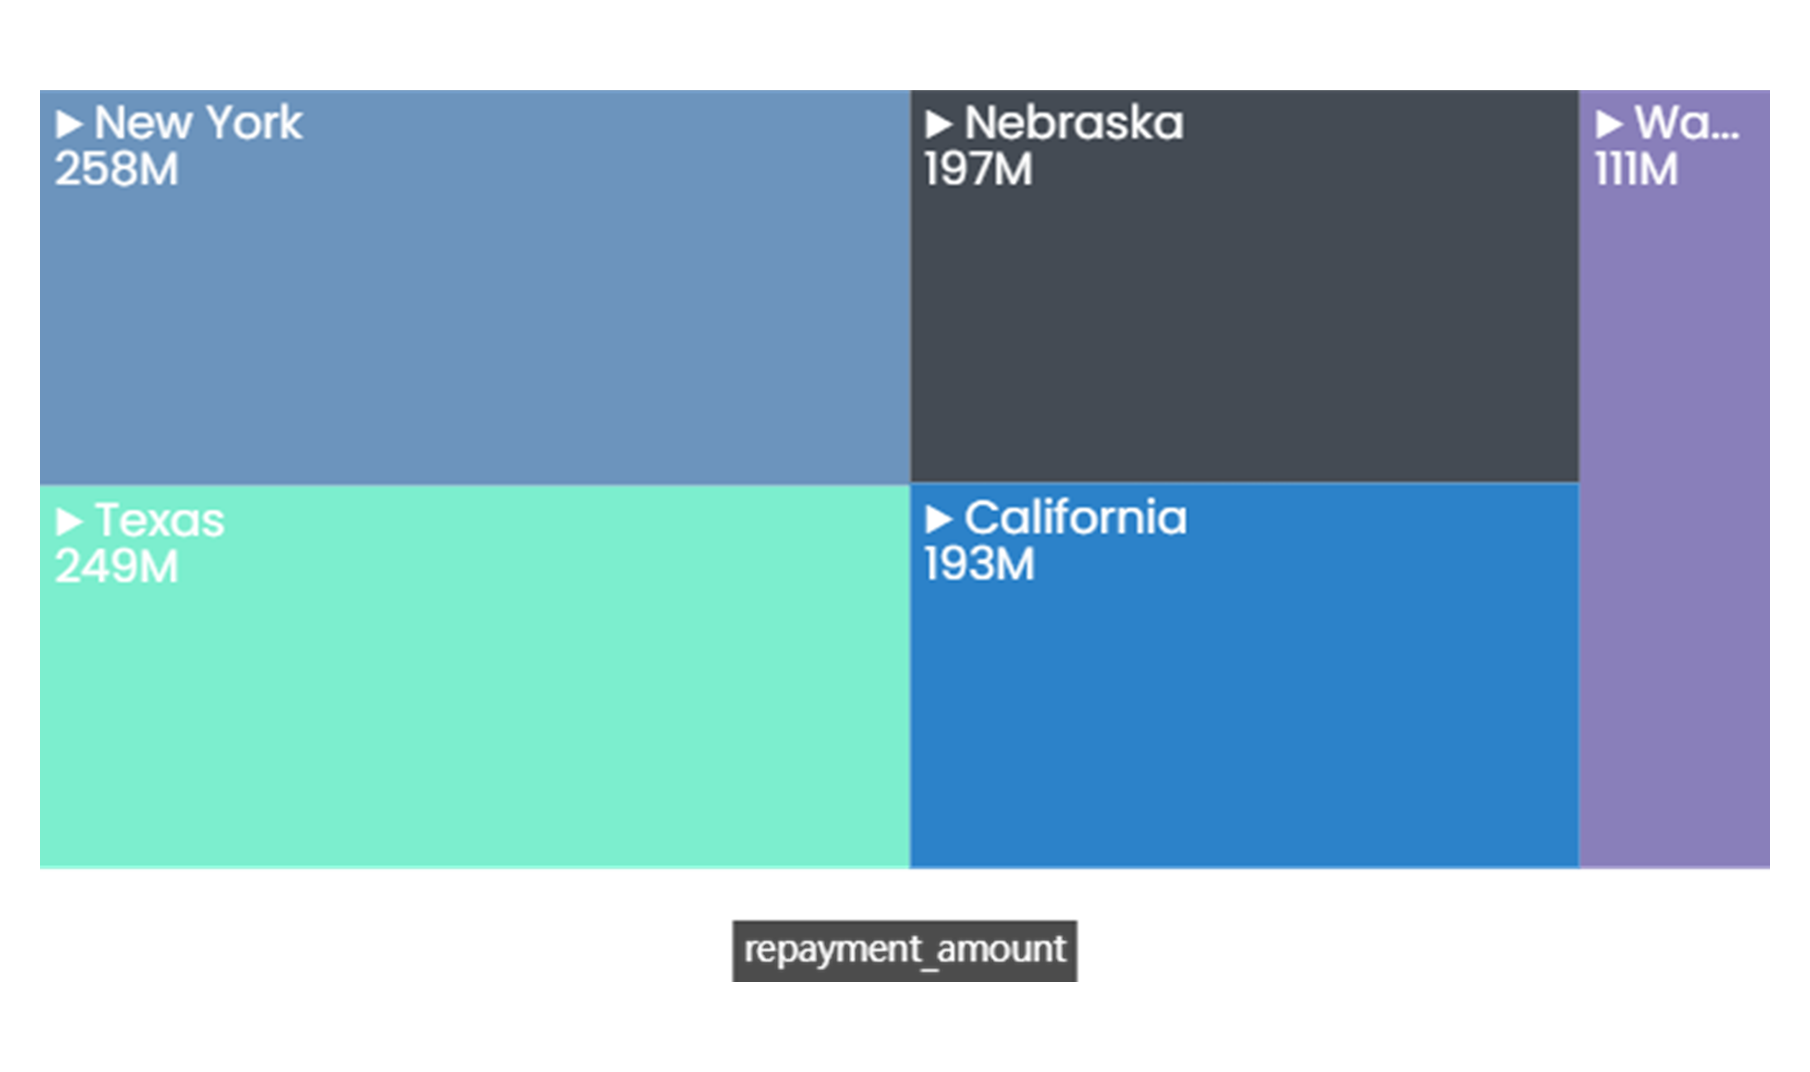
A treemap is a type of chart that displays hierarchical data using nested rectangles with smaller rectangles nested within larger ones to show the relationship between outer and inner rectangles. Each rectangle in the chart represents a category, and its size corresponds to a specific value, that contribute to the whole category.
When to Use a Treemap Chart
-
Showing Hierarchical Data: Treemaps are most commonly used to visualize hierarchical data structures.
-
Comparison: Treemaps can be used to compare the sizes of different categories within a hierarchy. The size of each rectangle represents a quantitative value, allowing you to easily compare the relative sizes of categories.
-
Distribution: Treemaps can also be used to analyze the proportions of a whole. By comparing the sizes of the rectangles, you can see how each category contributes to the total.
-
Showing Part-to-Whole Relationships: Treemaps can effectively show part-to-whole relationships within a hierarchy. Each rectangle represents a part of the whole, and the entire treemap represents the complete data set.
Do’s:
- Use a legend to provide additional information about each bubble or group.
Don’ts:
-
Don’t use when precise comparisons between categories are necessary.
-
Don’t use when you don’t have a hierarchical data, as it may not provide meaningful insights.
-
Don’t use with too many colors or shades, as this can make it difficult to interpret and compare the data.
-
Don’t overcrowd the treemap with too much information, as this can reduce readability and effectiveness.