Views
Views in Infoveave significantly enhance dashboard interactivity by offering detailed visualizations linked to existing widgets. Unlike standard tooltips that provide basic data summaries, views present in-depth insights using charts, tables, or other widgets. These detailed visualizations improve data granularity and help explore complex information in a more meaningful and interactive way. By leveraging views, dashboards become more dynamic and insightful, enabling better storytelling and decision-making.
Key Features of Views
-
Customized Visualizations: Views replace basic tooltips with fully customized widgets or groups of widgets. These can include bar charts, pie charts, tables, or any other visual format to display data in a richer, more interactive way.
-
Data Filtering: Views dynamically filter data based on the selected dimension or measure in the main widget. For instance, clicking on a specific data point in the main visualization automatically filters the view to display related details.
-
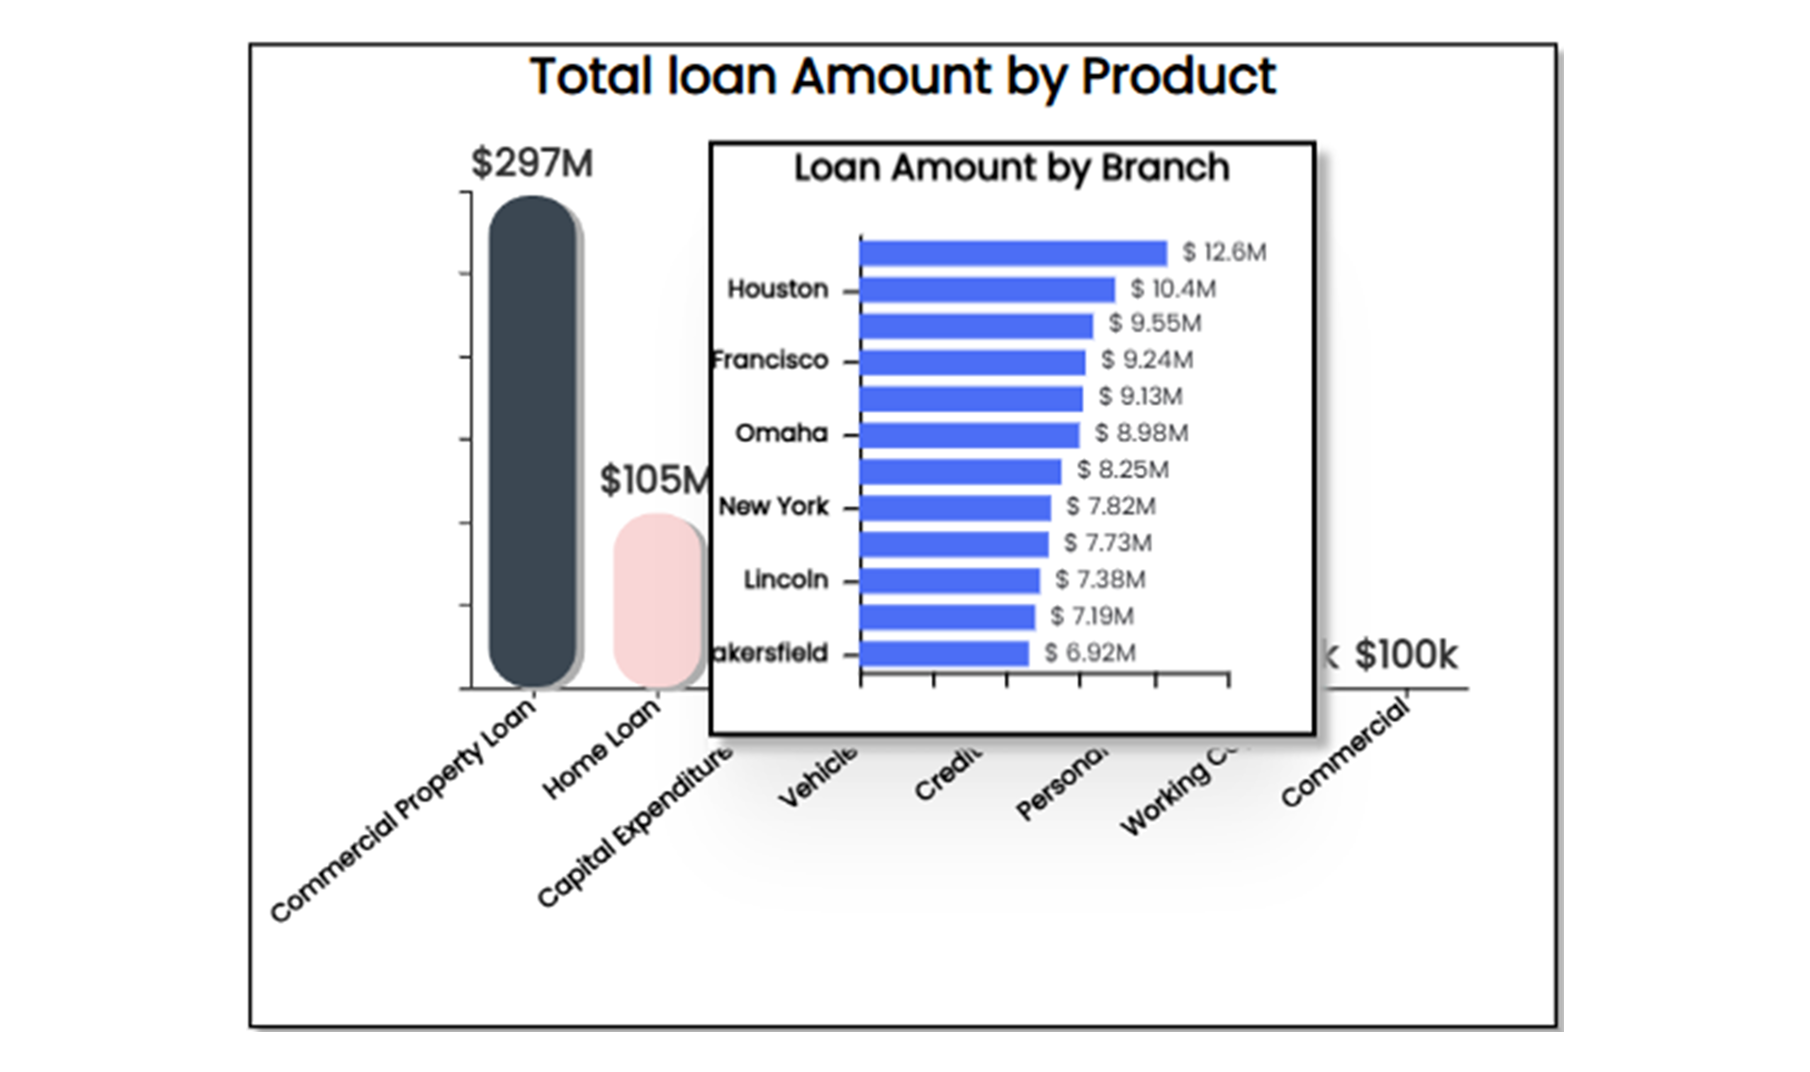
Drill-Down Support: Views allow smooth drill-down functionality to explore data in greater detail. For example, clicking on a bar chart summarizing loan approvals can open a view with a detailed breakdown.
-
Dynamic Interaction: Views provide real-time updates and tailored insights directly within the dashboard, triggered by hovering over or interacting with widgets.