Create PowerPoint Template Report in Infoveave
Creating a PowerPoint report using the Infoveave plugin is a simple process that integrates dynamic data and visualizations directly into your presentations. Like the excel templates, Infoveave PowerPoint reports also use relative date ranges, such as “This Month,” “Last 4 Weeks,” or “This Year,” to ensure that all data and visualizations stay refreshed and relevant to the requested date. Here are steps to install the Infoveave plugin, link your PowerPoint template, add widgets, and manage reports efficiently.
Step 1: Install and Set Up the Infoveave Plugin
-
Install Infoveave Plugin: Install the Infoveave plugin in PowerPoint, going to the Home tab, and adding the plugin. Once installed, log in using your Infoveave URL and credentials.
-
Select Template: Select the appropriate report template to structure your data that suits your requirements
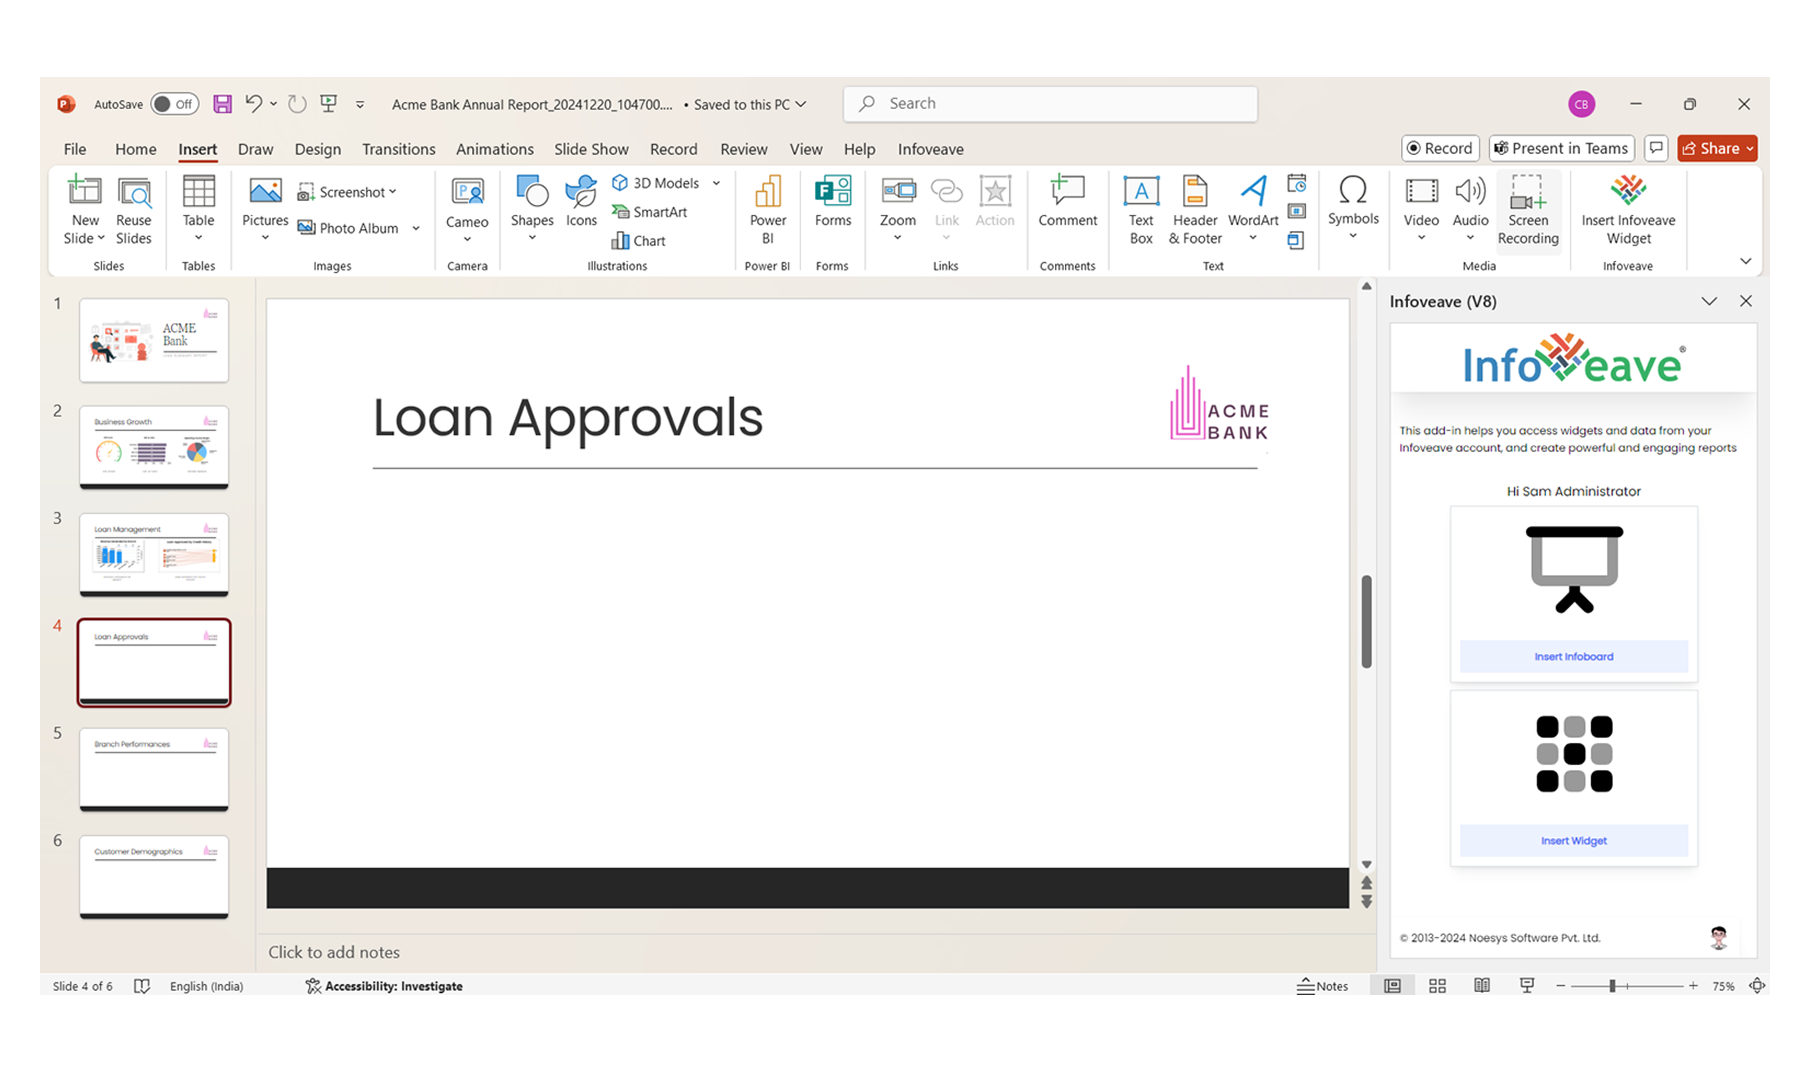
Step 2: Insert Widget into the Template
-
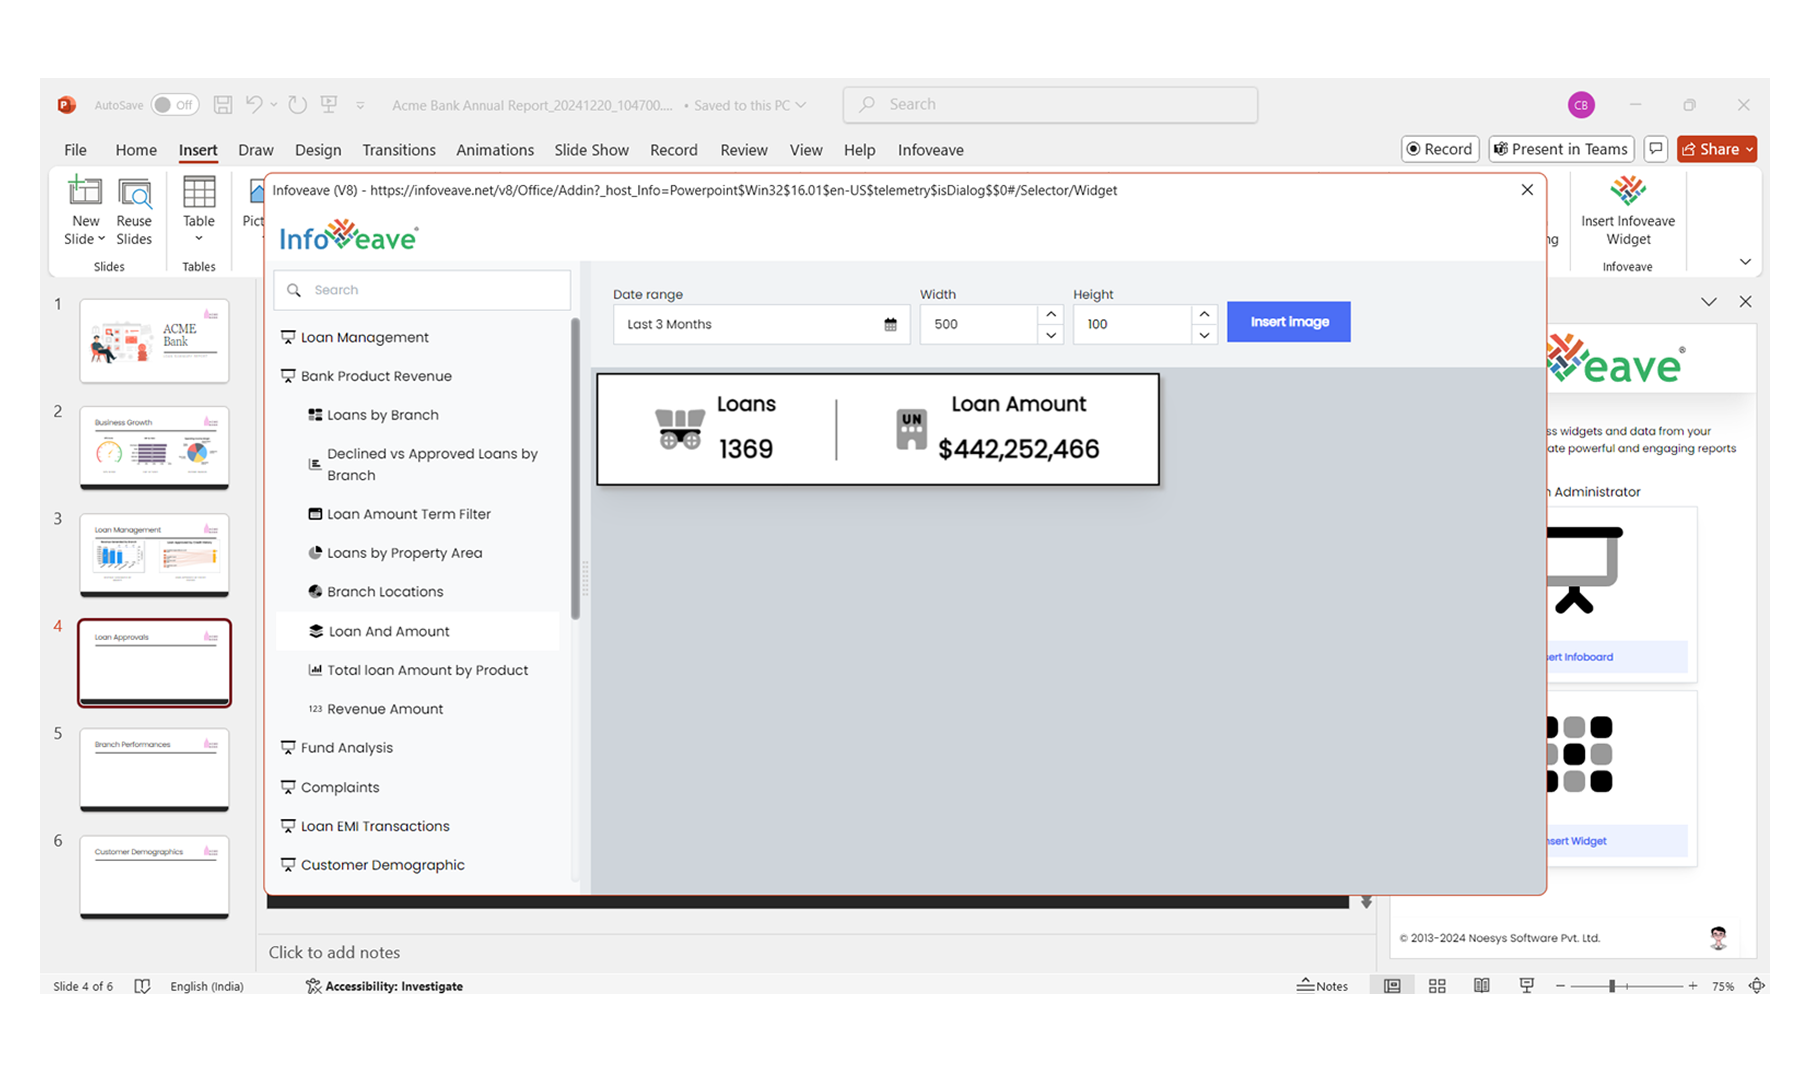
Insert Widgets: Click Insert Widget, select the desired Infoboard, and choose the specific widget to insert, such as charts, graphs, or tables to the PowerPoint slides.
-
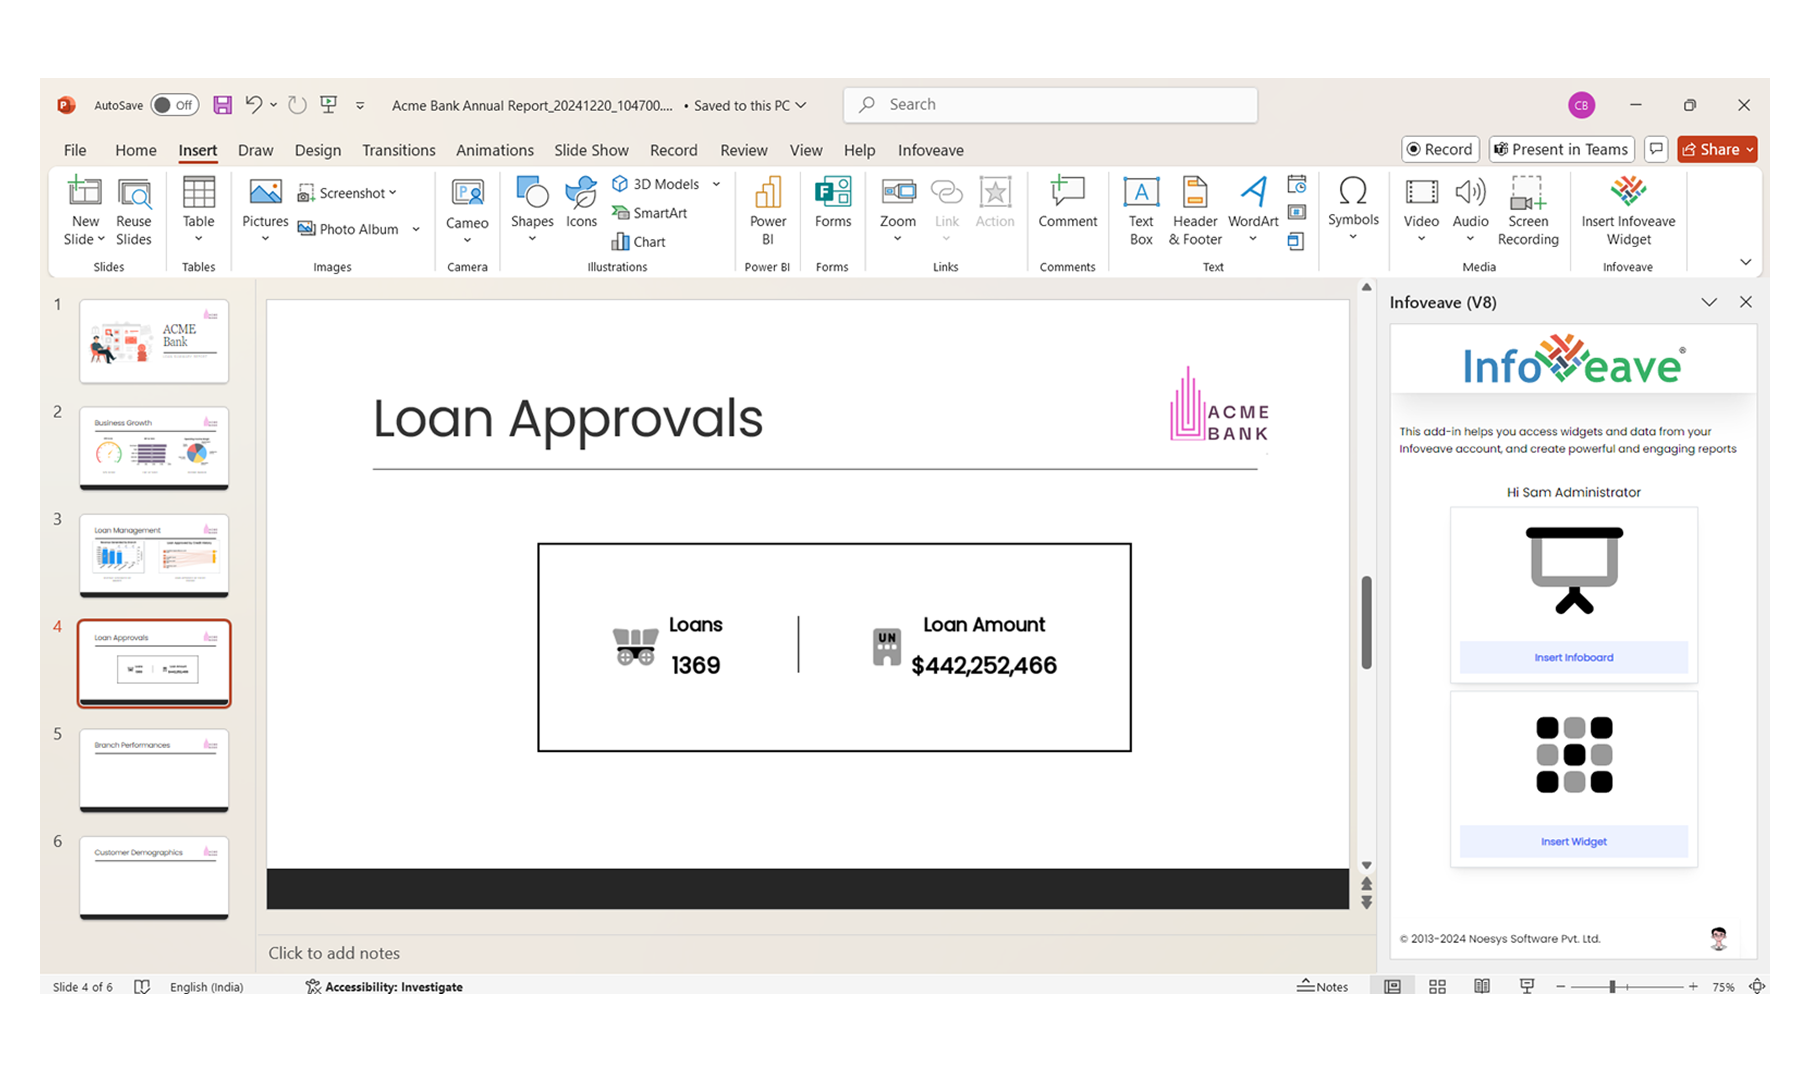
Define Date Range: Define the date range for the widget, like “Last 4 Weeks” or “This Year.” Set the width and height of the widget to fit perfectly in your slide. When everything looks good, click Insert Image to add the visualization to your PowerPoint slide.
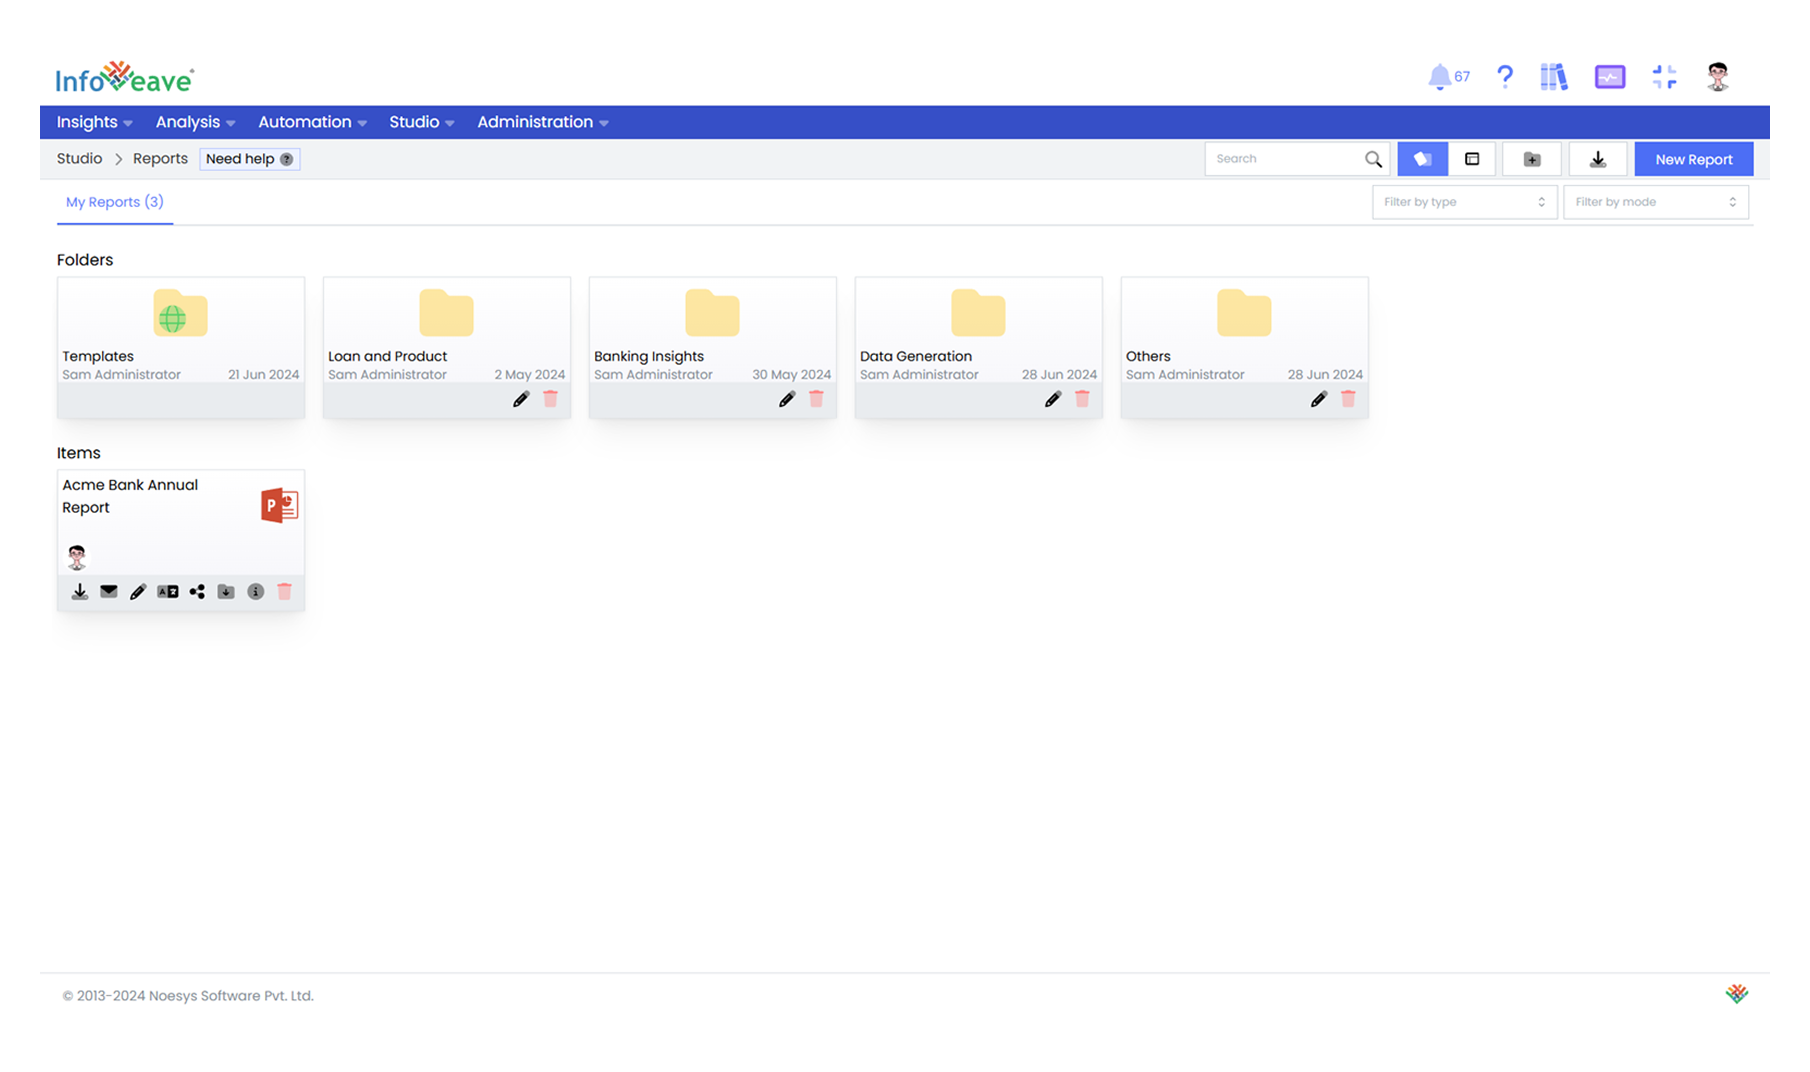
Step 3: Add Widgets and Upload Template in Infoveave
- Add Widgets and Dashboards to Template: Insert the data as a table or add it directly into your PowerPoint template.
- Upload the Template in Infoveave: Log in to your Infoveave account, go to the Studio section, and click Reports to upload the prepared PowerPoint template to Infoveave.