
Line Chart
A line chart is a type of graphical representation of the continuous progression of data points over a time period. The chart connects the data points; each point corresponds to a specific value of a variable through a simple line, hence the title line chart. A line chart consists of both a numerical and a categorical axis representing the numerical values (quantities, percentages, scores, or any measurable data) and the category (time period or sequentially ordered categories, such as months or stages of a process).
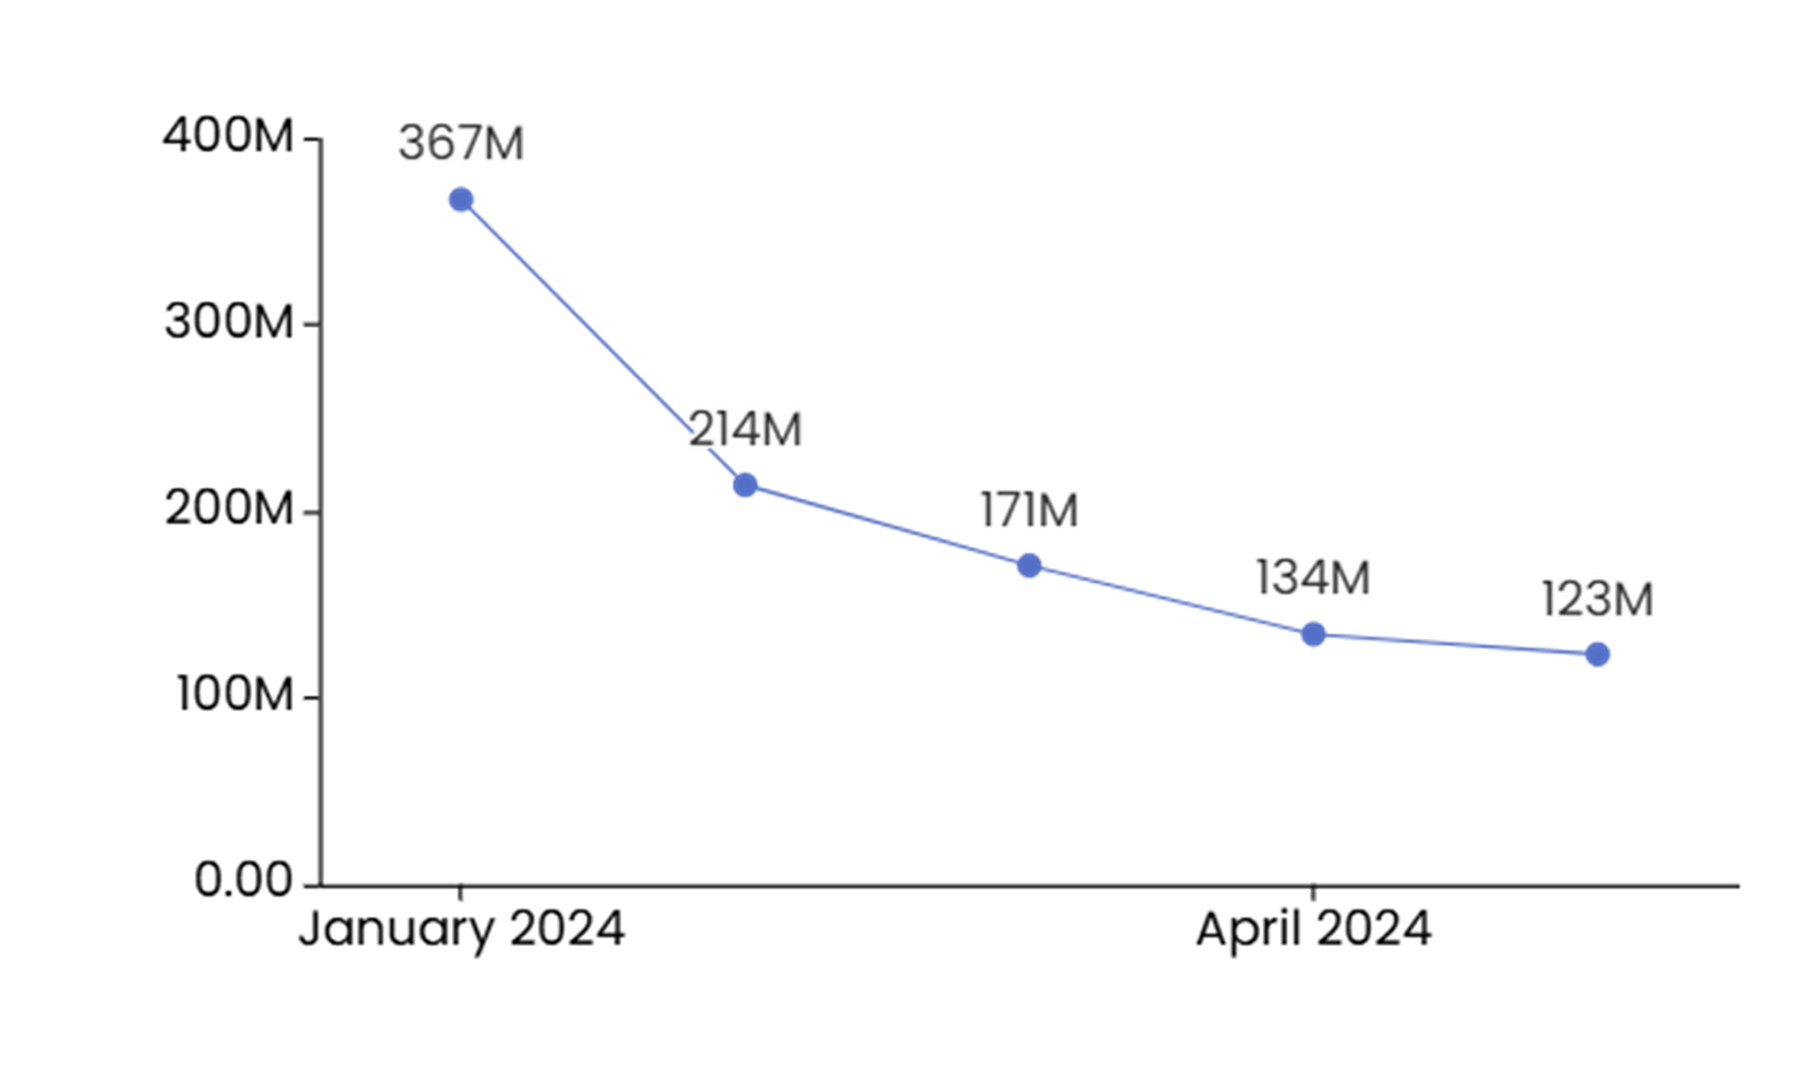
A line chart helps you track, illustrate, and emphasize the continuity and progression of values as they change. The direction and slope in the line chart convey valuable insights, such as that upward trends indicate increasing values, downward trends show decreases, and flat lines suggest stability or no change in the data.
When to Use a Line Chart
-
Showing Trends Over Time: Line charts are most commonly used to show trends in data over time. They are particularly effective for displaying continuous data, where the data points are connected to show the progression over time.
-
Comparing Trends: Line charts can also be used to compare trends between different categories or groups.
-
Highlighting Patterns: Line charts can help highlight patterns or anomalies in data. By connecting the data points, line charts make it easier to see trends, cycles, or irregularities in the data.
Do’s:
-
Use a line chart to show trends over time or to compare trends between different categories or groups.
-
Use clear and concise labels for the x-axis (time or categories) and y-axis (values) to ensure the chart is easy to understand.
-
Use different line styles or colors when using multiline chart.
Don’ts:
-
Don’t use a line chart for categorical data (use a bar chart or column chart instead).
-
Don’t overcrowd the chart with too many lines or data points.