
Data Visualization in Infoveave
Infoveave helps transform data into impactful visualizations and compelling stories. It empowers businesses to communicate their data clearly and effectively. With its domain-specific and customizable templates, it caters to a wide range of industries, with tailored visualizations that address unique business needs. It supports data visualization through features like industry-specific and customizable templates.
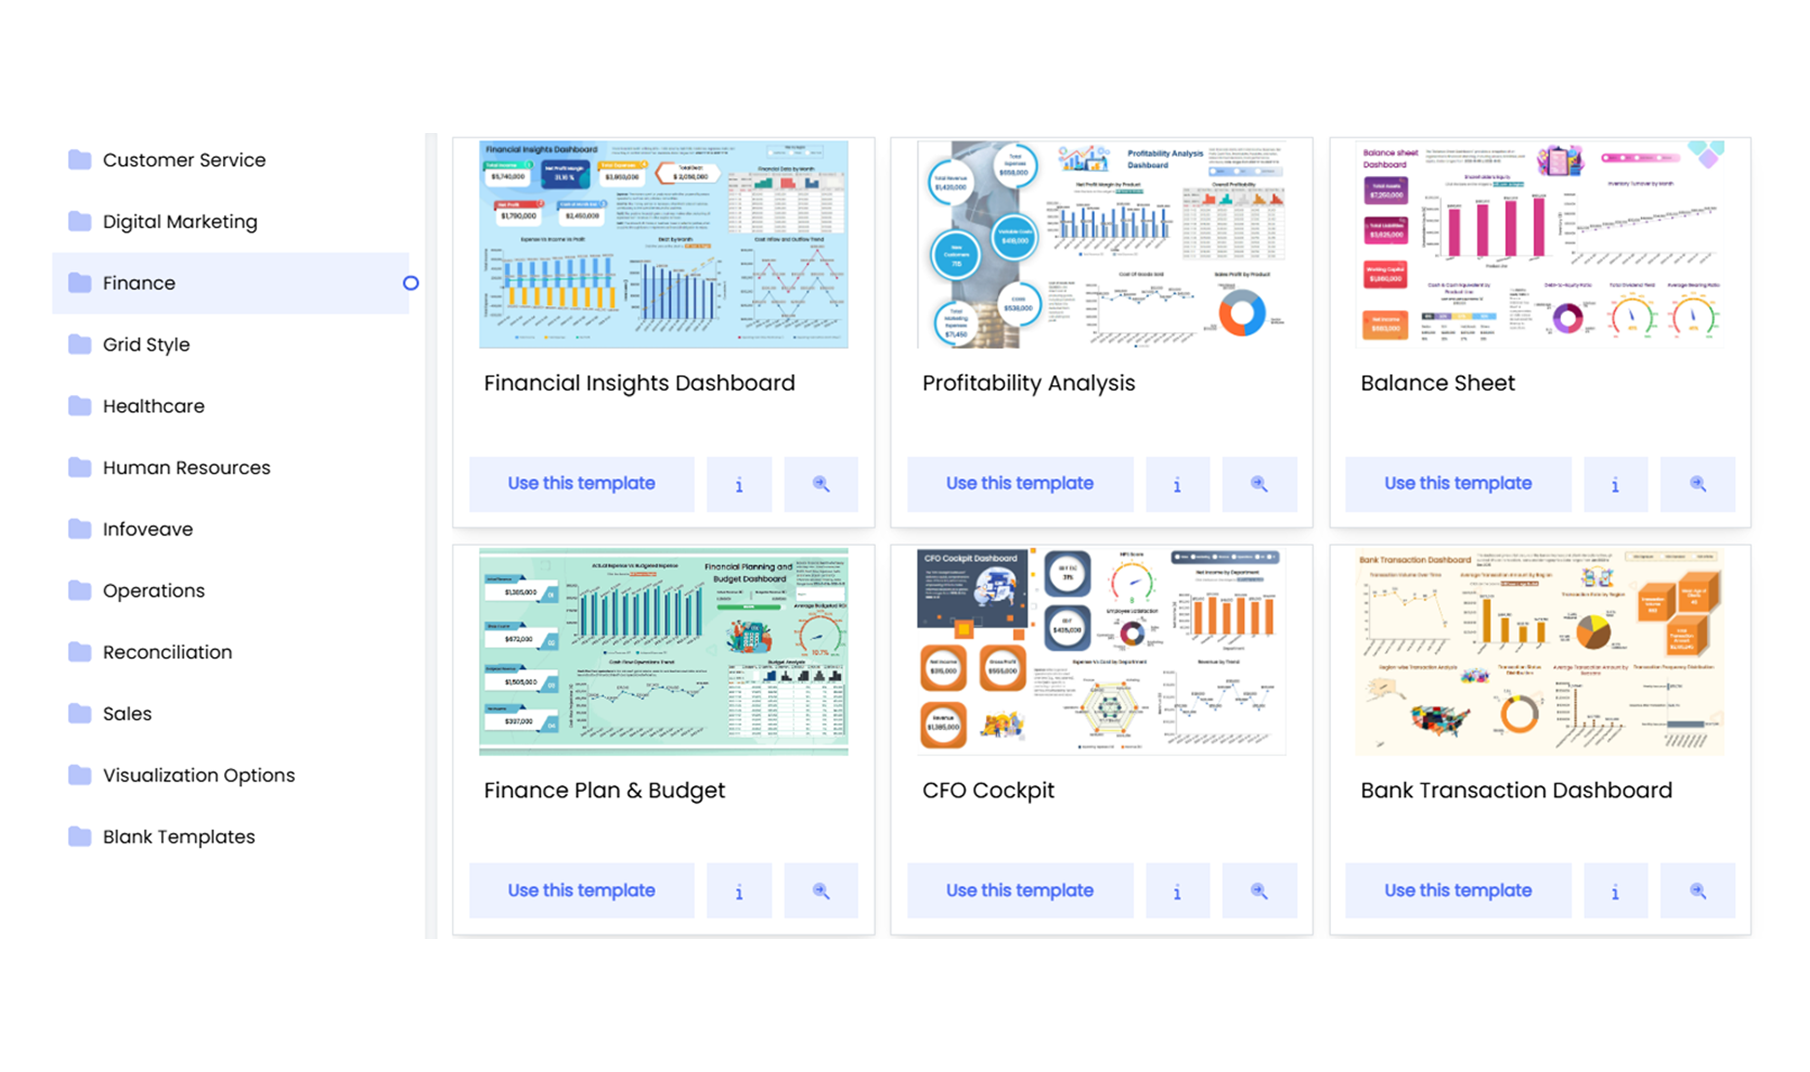
Industry-specific and Customizable Templates
Infoveave offers dashboard templates tailored to specific industries and business functions. These templates eliminate the need to start from scratch, saving time and ensuring industry best practices. Industries include:
-
Sales and Marketing: Templates for tracking sales performance, customer acquisition, marketing ROI, and campaign effectiveness.
-
Finance: Dashboards for monitoring revenue, expenses, profit margins, and financial forecasts.
-
Human Resources: Tools to visualize workforce metrics like employee performance, attrition rates, and diversity.
-
Supply Chain Management: Templates for inventory tracking, logistics efficiency, and supplier performance.
-
Healthcare: Visualizations for patient records, treatment outcomes, and operational efficiency in medical facilities.
-
Banking: Dashboards for analysing loan performance, customer portfolios, transaction trends, and compliance metrics.
Customization allows to adapt templates as per business requirements. Key customization options include:
-
Change Chart Types: Switch between different visualization types, such as bar charts to line graphs, based on data preferences.
-
Define Colors and Themes: Align the design of dashboards with corporate branding by customizing colors, fonts, and layouts.
-
Apply Filters: Add dropdowns, checkboxes, and filters to enhance dashboard interactivity, flexibility, and enable extraction of key insights.
-
Integrate Datasources: Connect templates to various Datasources like spreadsheets, databases, and APIs, ensuring accurate and up-to-date visualizations.
-
Create Custom Metrics: Create custom columns that are relevant to your business needs using Infoveave functions.
-
Configure Conditional Expressions: Implement conditional logic or board expressions to highlight key metrics, set thresholds, or dynamically adjust visual elements based on data changes.
-
Setup Actions: Add interactivity to dashboards, such as navigating to Infoboards, refreshing data, opening URLs, downloading reports, triggering workflows, and clearing filters for improved interactivity and user experience.
Now that we know how Infoveave simplifies data visualization with impactful dashboards, let us explore the features of the Infoboard Designer that support creating interactive and visually appealing dashboards.