
Creating a Dashboard in Infoveave
Creating a dashboard in Infoveave is a step-by-step process that involves connecting to a datasource, designing the layout, configuring widgets, and enabling interactivity. Dashboards act as powerful tools to visualize data, uncover insights, and support decision-making in an organized and visually appealing way. A well-designed dashboard effectively communicates data and allows users to analyze key metrics in a visually engaging way. Below, we break down the steps for creating an interactive dashboard in Infoveave.
For the dashboard, we will use the following components:
-
Datasource: The bank loan dataset serves as the foundation for the dashboard. This dataset will power the widgets and ensure accurate and relevant visualizations.
-
Layout: We will use the Designer Layout, and the Desktop View of the canvas will be chosen as the primary layout for creating the dashboard.
-
Widgets: We will use widgets such as bar charts, treemaps, maps, and labels that display data from the bank loan dataset.
-
Interactivity Features: Interactivities such as filters, views, drill downs, and linked reports will be added on the dashboard.
The below section provides detailed instructions on building an interactive and functional dashboard in Infoveave.
Step 1: Select Dashboard Template
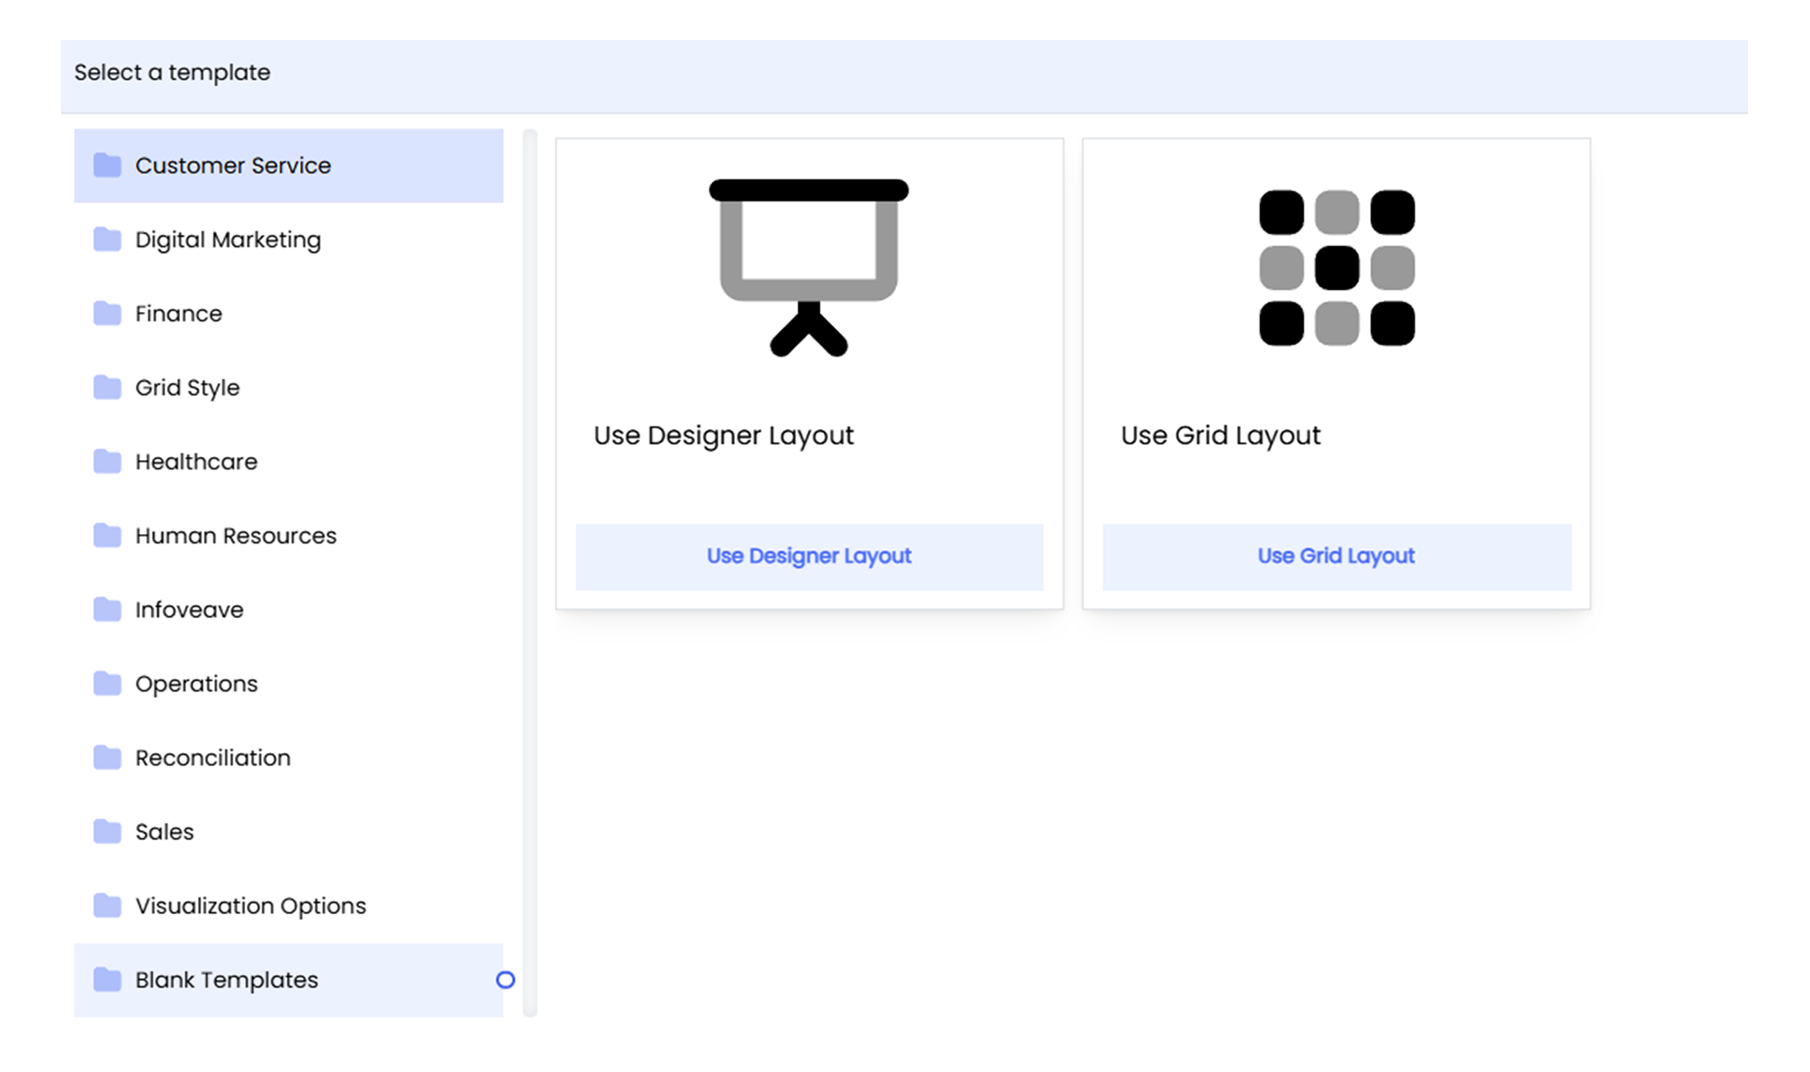
To design a dashboard, start by selecting a template from the Template Library. Infoveave offers many pre-designed templates for various needs. Here let us choose the Blank Designer Template. This option allows to create the dashboard layout from scratch.
- Select Template: In Infoveave, go to the Insights menu and click Create Infoboard to access the dashboard template library. From there, select the Blank Template and choose the Designer Layout option.
Step 2: Link Datasource
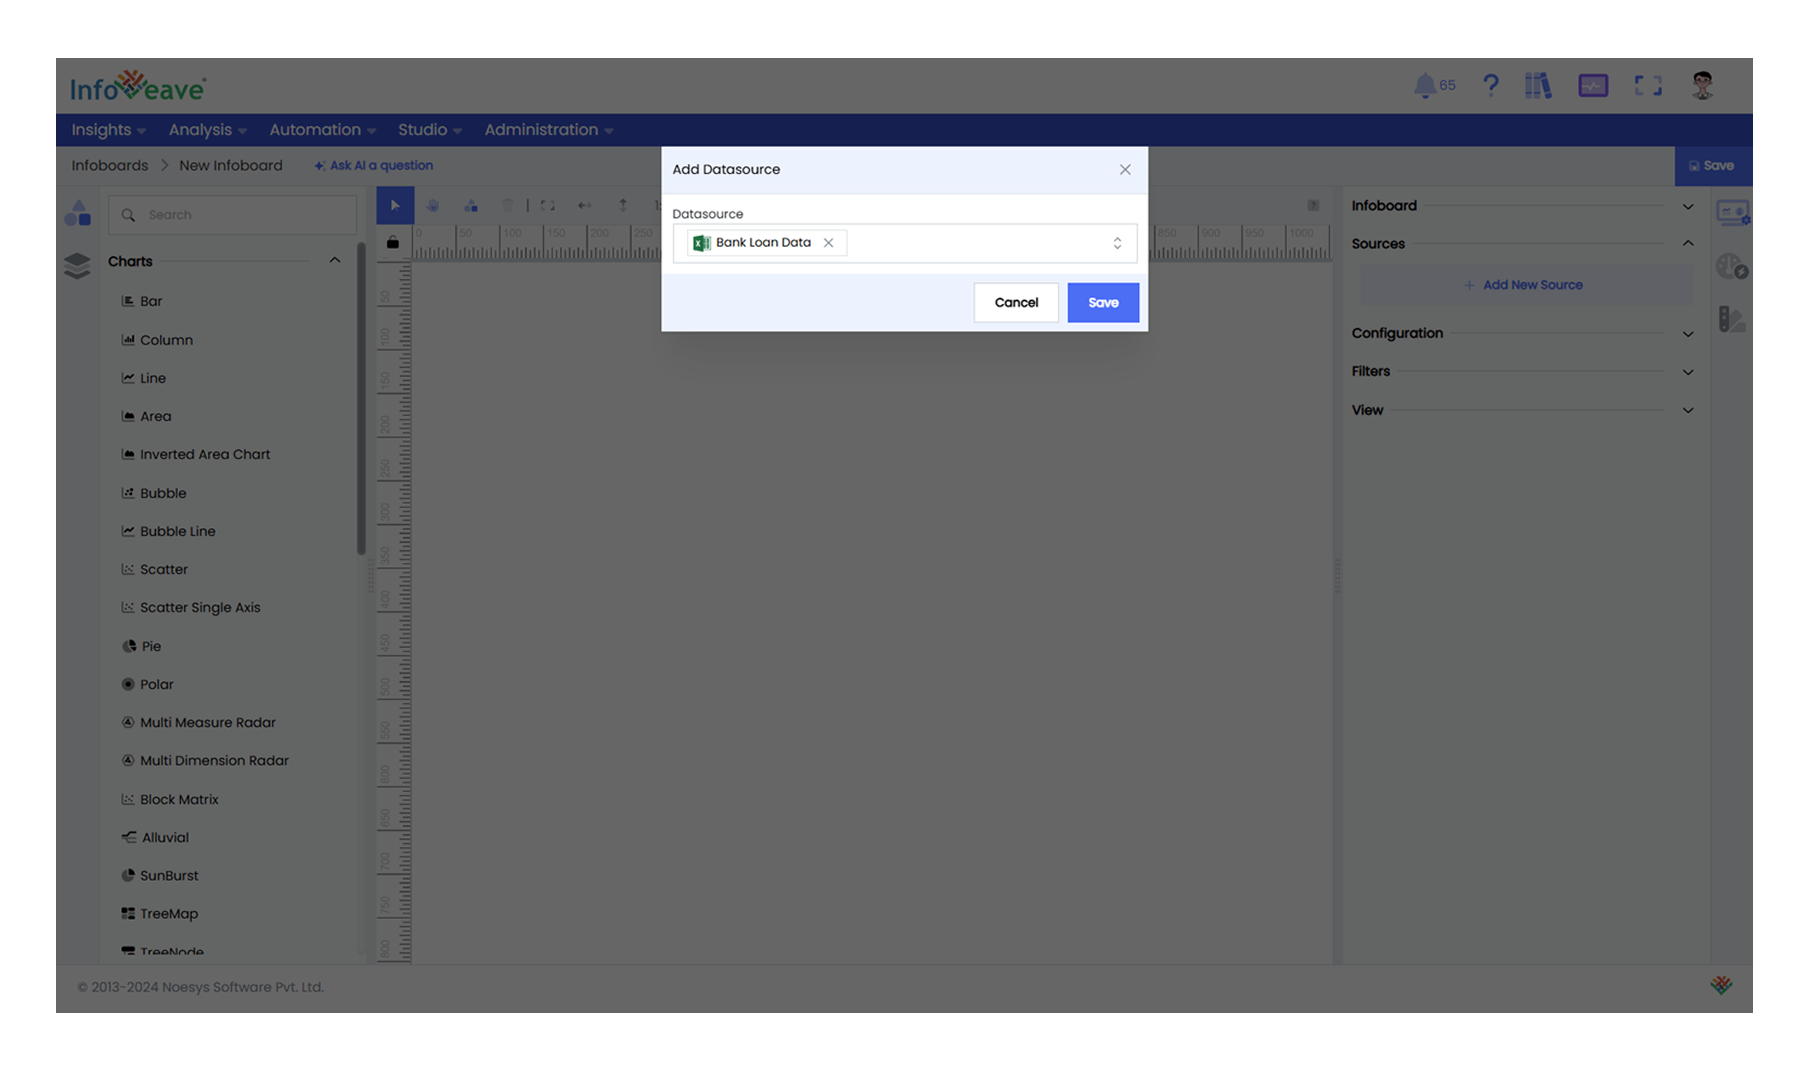
Once the template is selected, the next step is to link the dashboard to the appropriate datasources. If the required datasource has already been configured, simply select it from the pre-configured options. This ensures your Infoboard is connected to the right data for your widgets and visualizations.
- Add Datasource: To add the Datasource to your Infoboard, go to the Sources section and click the Add New Source button. From the available options, choose Start with Existing Datasource and select Bank Loan Data from the list.
Step 3: Add and Configure Widgets
After selecting the layout, the next step is to add and configure widgets onto the dashboard. Widgets are the visual components that present your data in a clear and interactive manner, helping to communicate insights effectively.
-
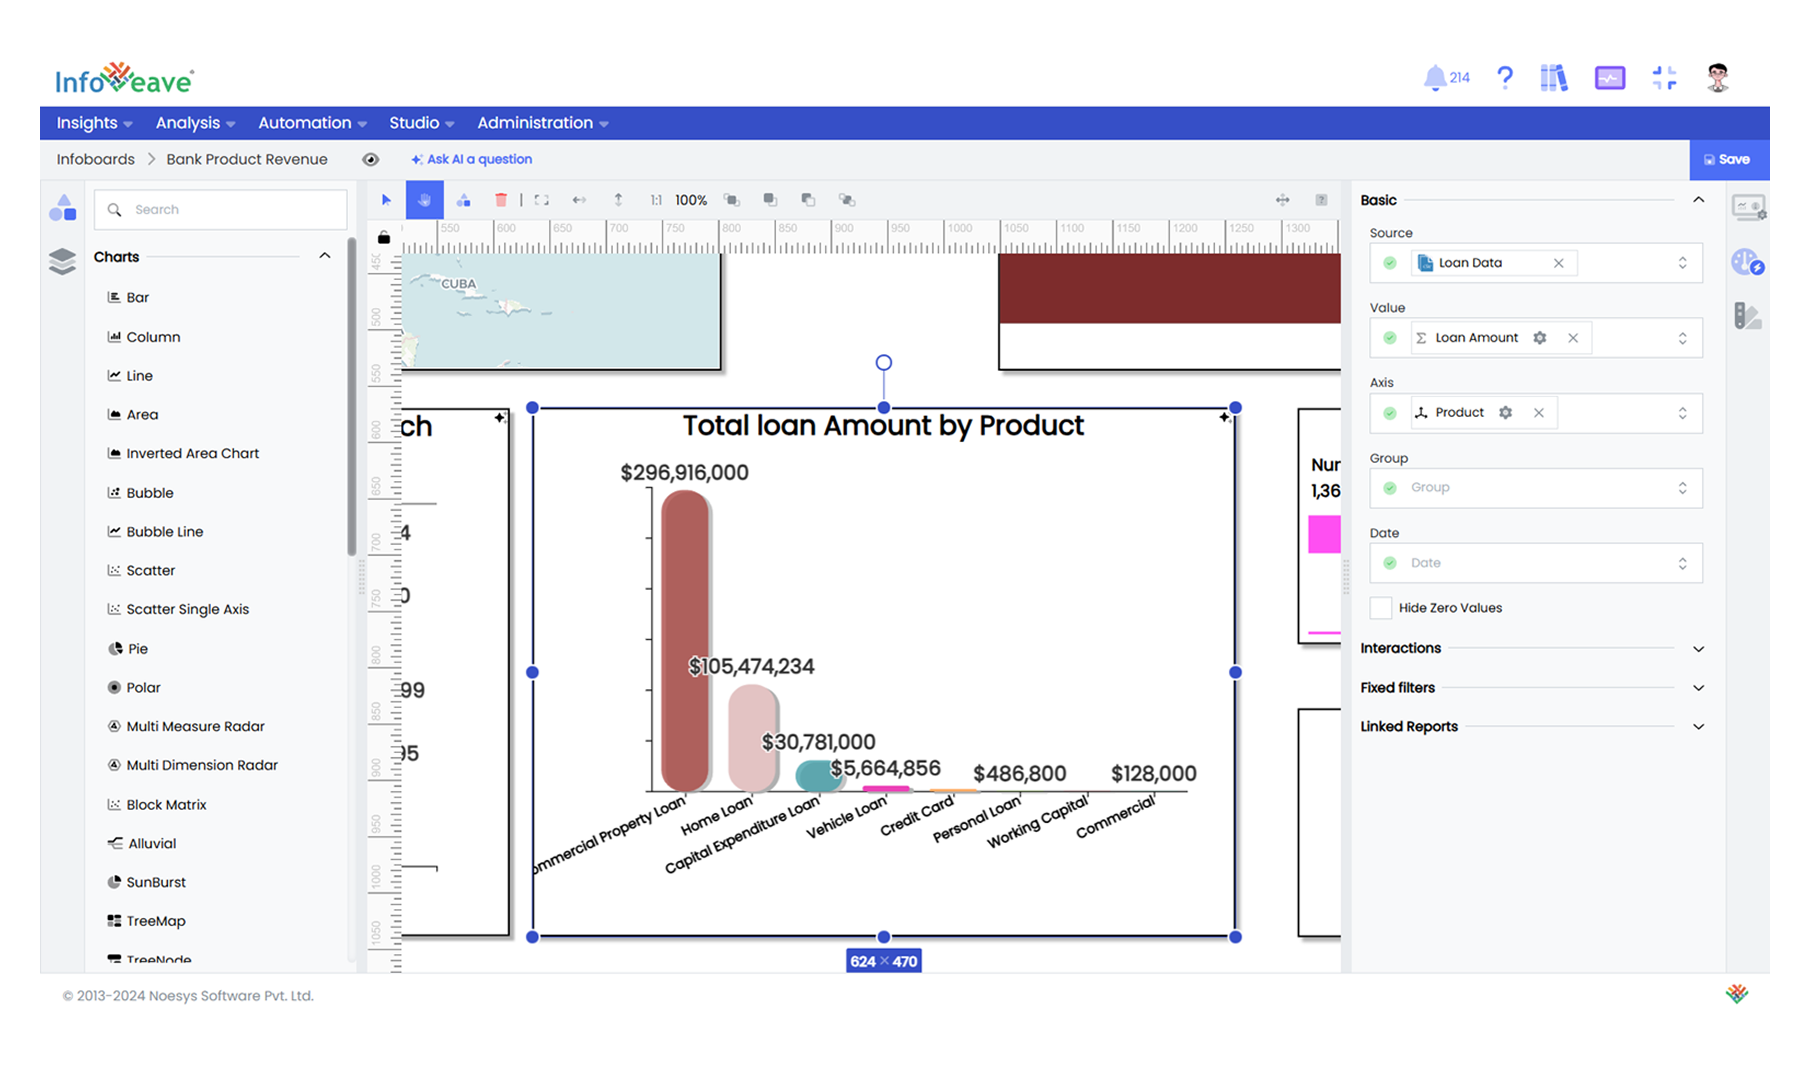
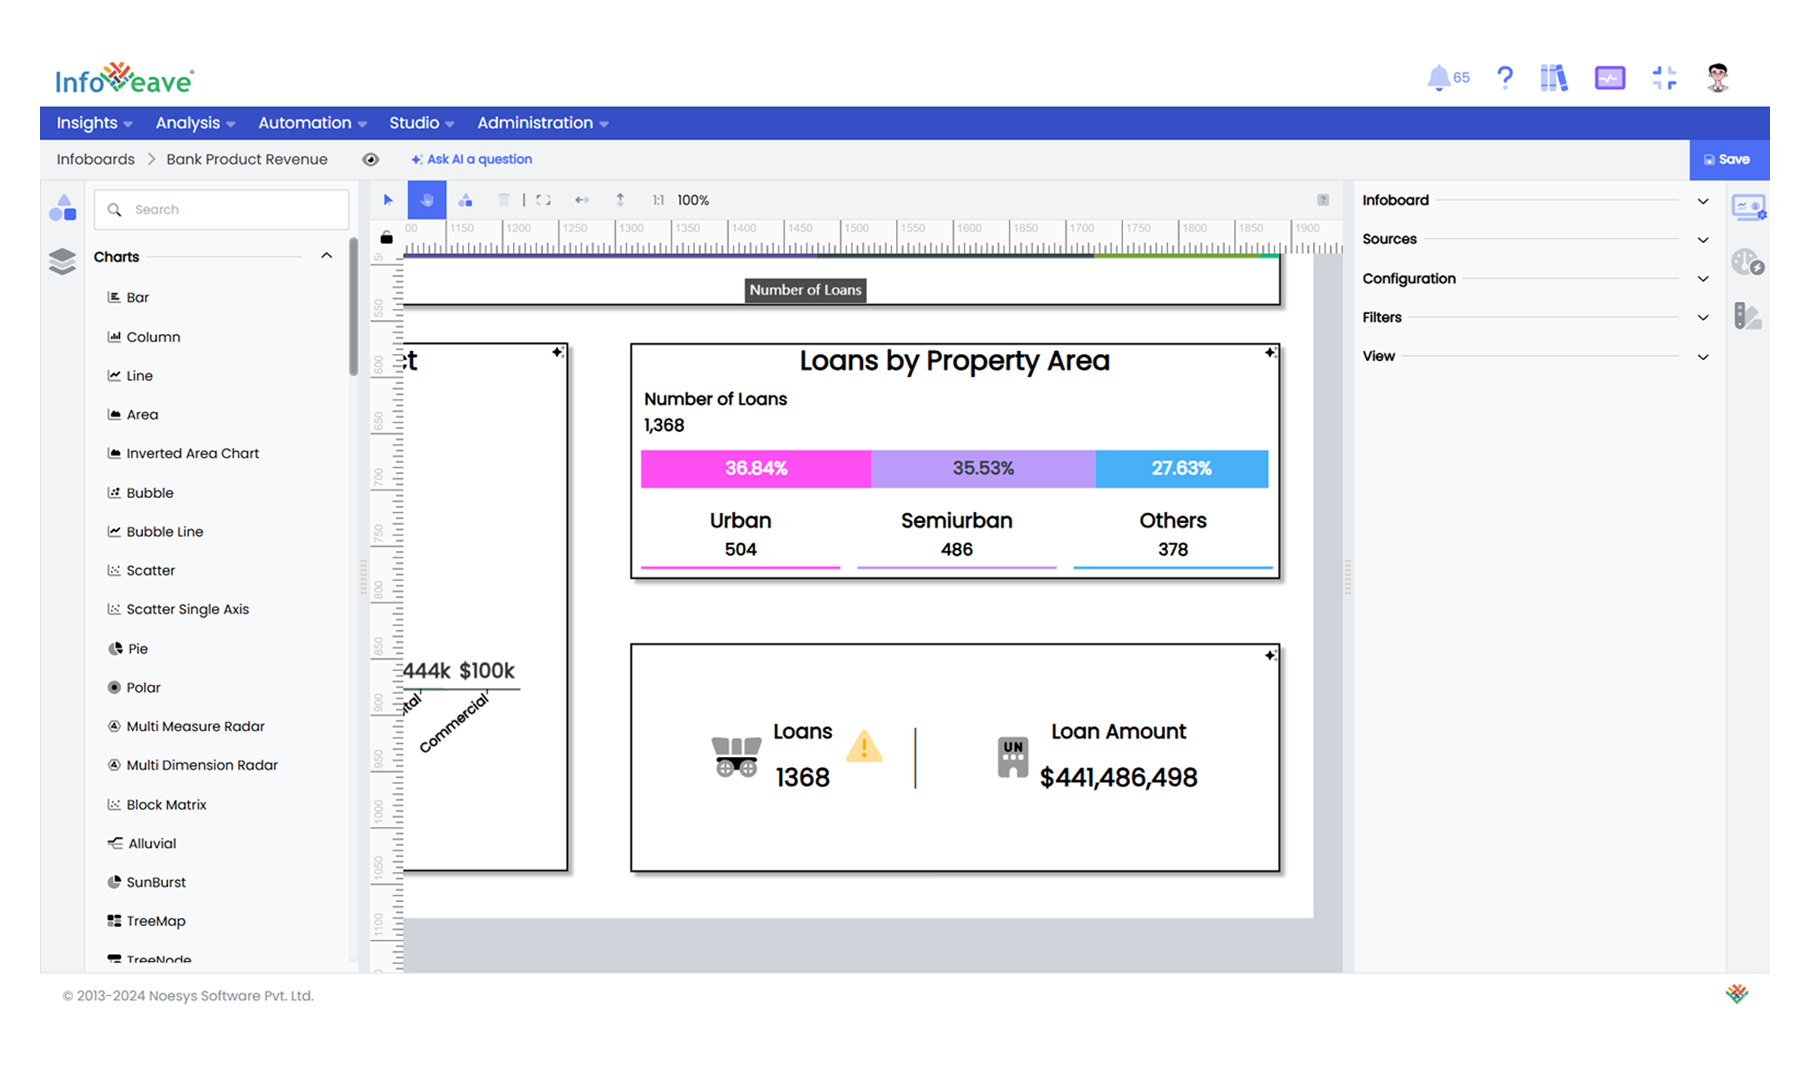
Add Widgets: Open the Component Panel, drag and drop or double click on the required widgets onto the dashboard layout. Select the widgets you want to use, such as charts, tables, or text boxes.
-
Configure Widgets: Configure each widget by linking it to the Bank Loan Data. Define the measures and dimensions for each widget to ensure they accurately reflect the data you need.
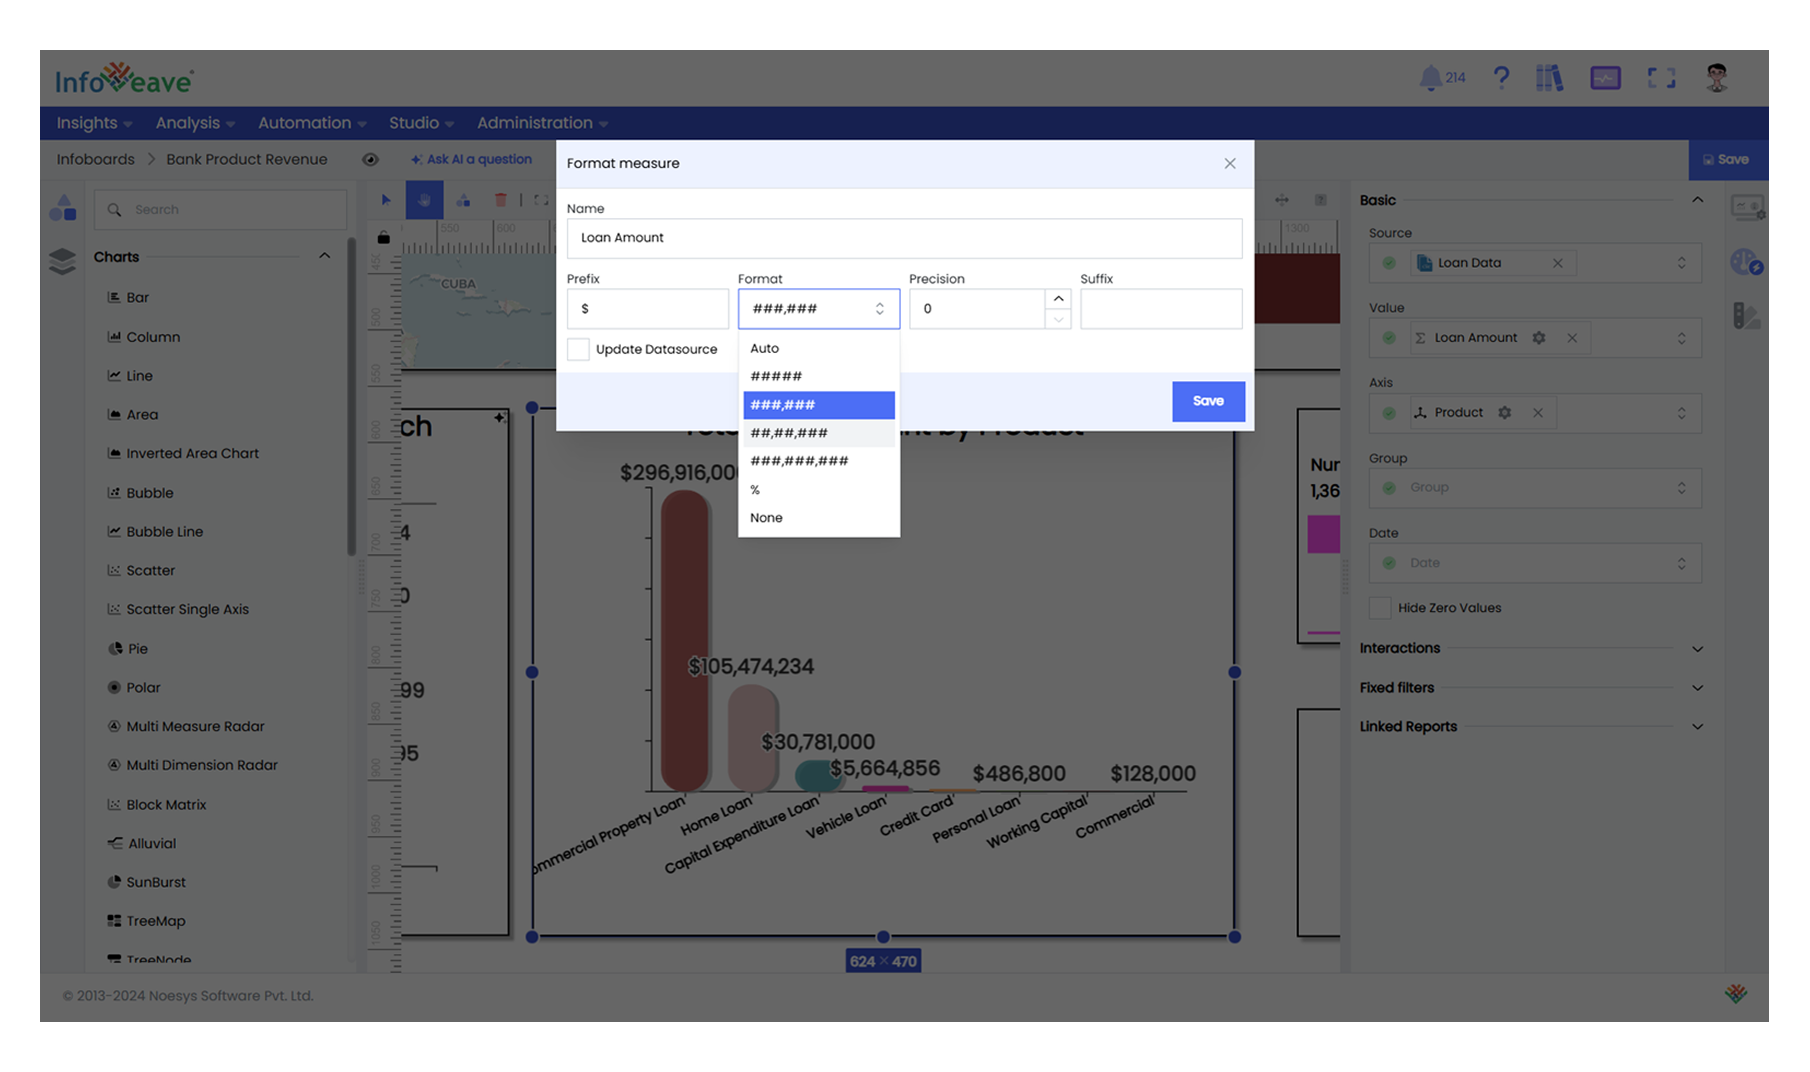
- Format Measure Value: Click the gear icon next to the measure value to format. Update the name, specify the unit, and include a prefix or suffix if needed. Choose a format (e.g., Auto or %) and set the precision for decimal places.
Step 3: Customize Widgets
Finally, customize the appearance of the widgets.
- Customization: To customize a widget, select the chart on the designer canvas and adjust options like styling (colors, fonts, and backgrounds), labels, edit axis names, values, or labels under the Label tab, better visibility.
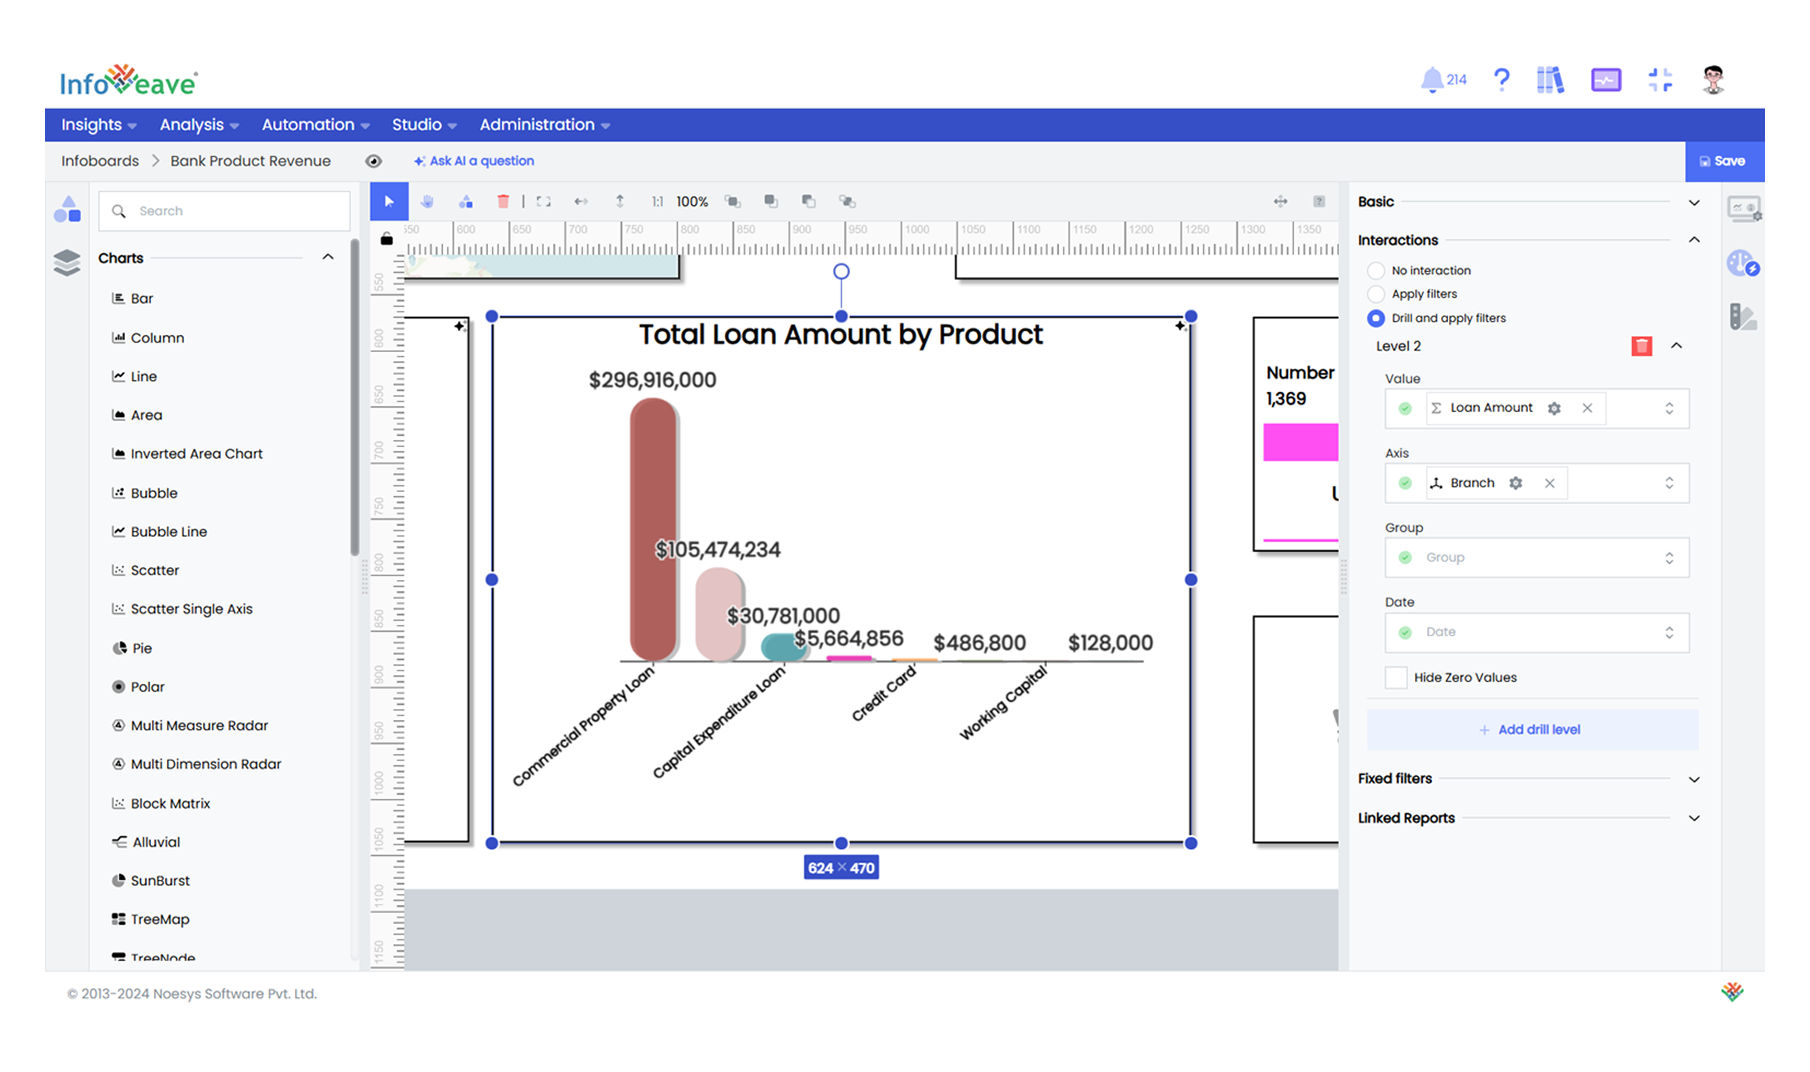
Step 4: Configure Interactions
- Enable Interactions: Open the interactions panel of the selected widget. Choose from the available options, such as Apply Filters or Drill-Down and Apply Filters, depending on the desired functionality.
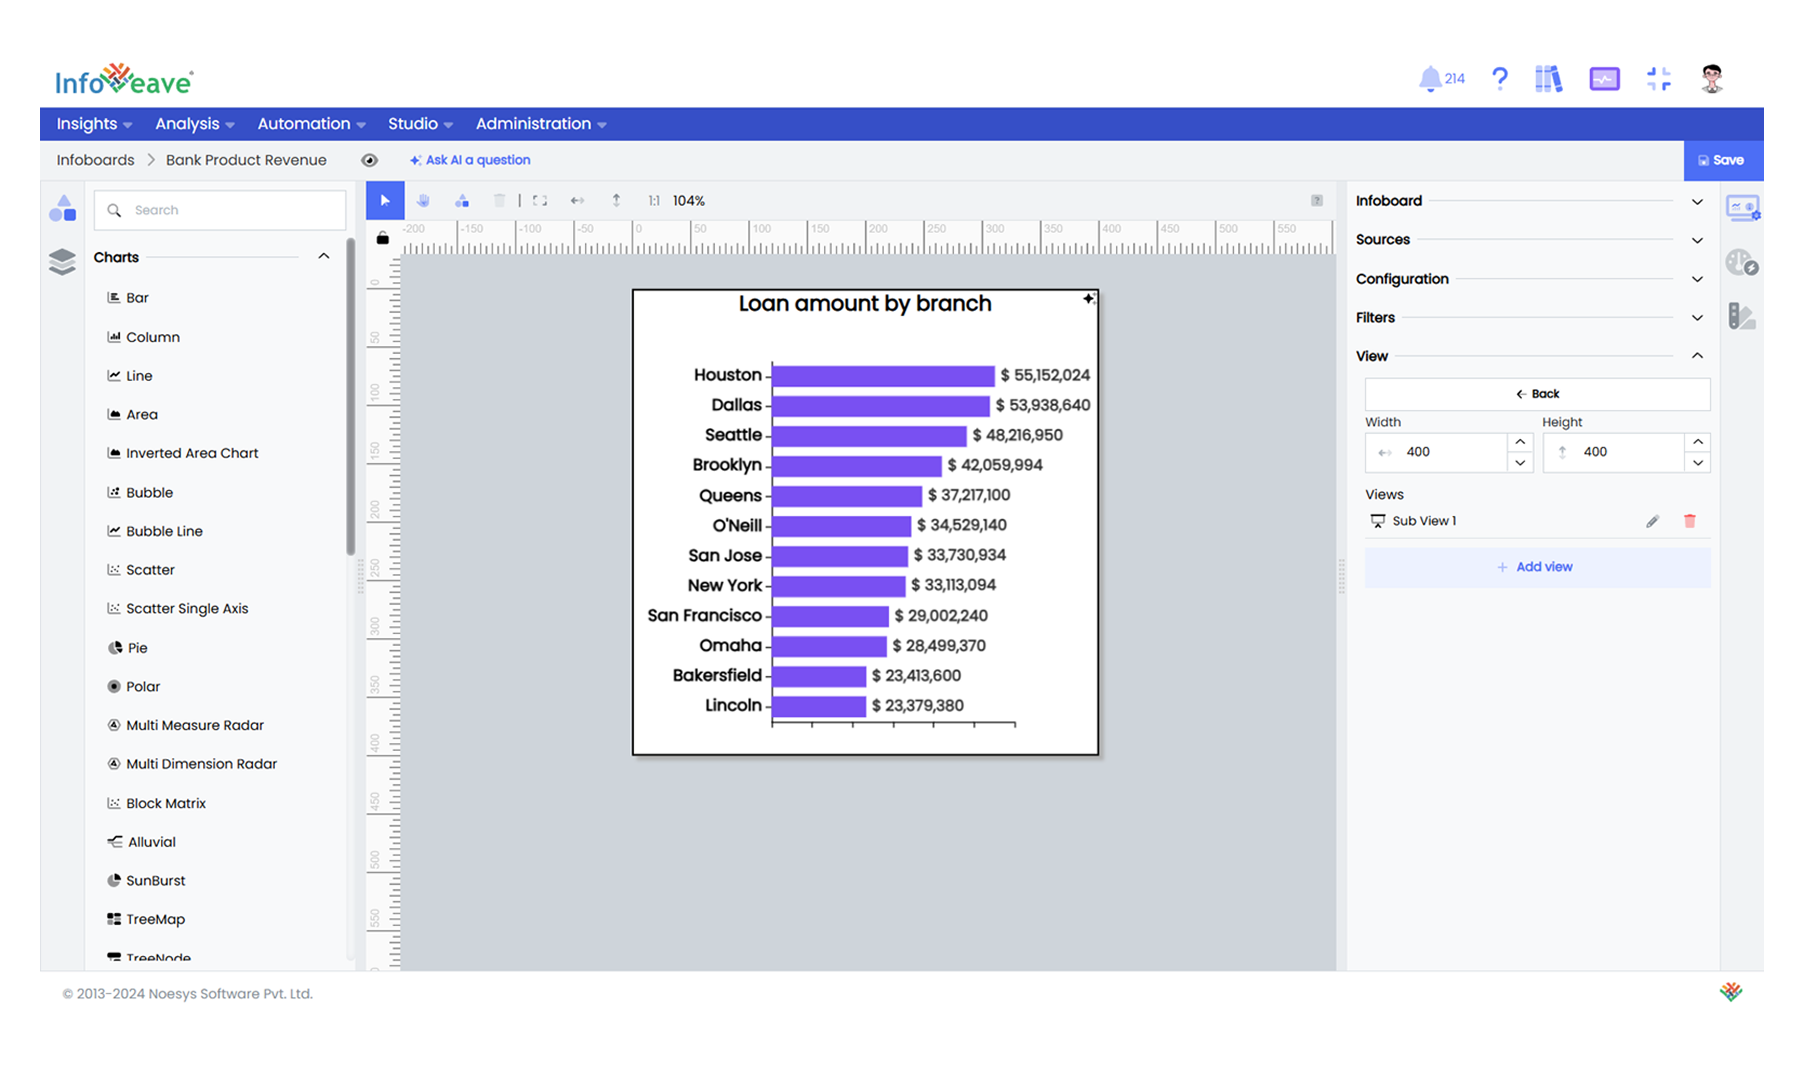
- Setup Views: Navigate to the Views section under Setup and click Add View. Drag and drop the required chart, configure and customize it to suit your needs.
- Configure Board Expression: Navigate to the Setup tab and click Configure Expression. In the expression editor, create a new rule, define conditions, and configure actions like changing widget properties or displaying messages when conditions are met.
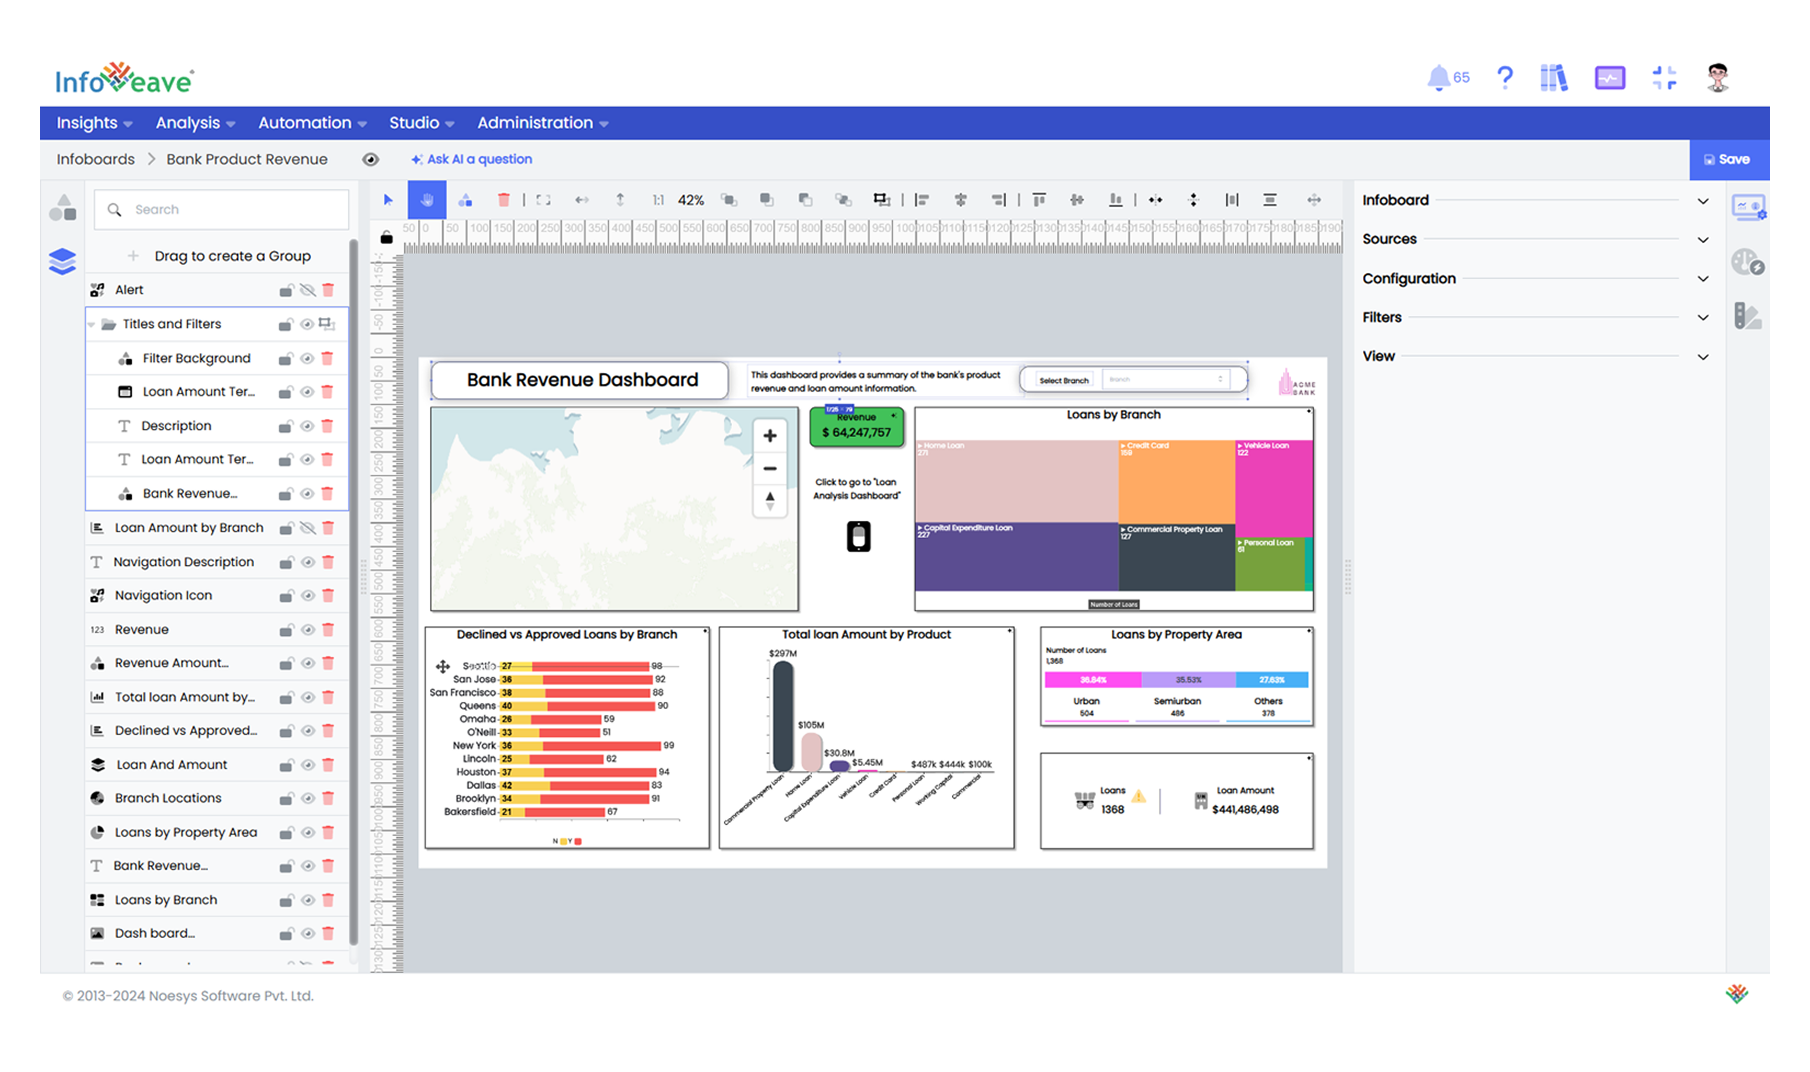
Step 5: Organize Widgets
- Group and Layer Widgets: Stack widgets using layering to control their visibility with Z-index, and group multiple widgets into a single entity to simplify movement, alignment, and styling.
With the dashboard created in Infoveave, the next step is to explore how to create template reports, which can later be linked to the dashboard widgets to provide detailed insights and downloadable data for users. In the next section, we will explore how to create template reports in Infoveave.